Why Components Fail on Nickel-Gold Plated FPC Boards: Causes and Insights
Before mounting components via SMT, manufacturers must treat the FPC surface and solderable component ends. This ensures solderability, connection reliability, and contact reliability.
The surface treatment process significantly impacts SMT placement results and may lead to issues such as soldering defects and assembly failures.
Nickel-gold plating serves as an effective surface treatment method. The gold layer prevents oxidation of the nickel layer. It forms metallic compounds—AuSn, AuSn₂, and AuSn₃—between the solder and component terminals during soldering. These compounds create the solder joint between the nickel layer and solder post-soldering.
Therefore, the gold layer must be sufficiently thick to protect the nickel layer while avoiding brittleness and solderability issues that arise when gold content exceeds 3%.
Experts analyzed failures from “dark gold” and poor wettability in nickel-gold plating. They found that excessively thin gold layers cannot protect the nickel, causing oxidation.
The high melting point of the resulting oxides prevents intermetallic compound (IMC) formation during soldering. Furthermore, plating defects like voids contaminate the underlying nickel layer, contributing to poor wettability.
This paper investigates the failure mode of component detachment occurring on an electroplated nickel-gold FPC board after SMT. Analytical testing methods were used to examine the failure. Failure morphology and elemental composition at the site identified the root cause.
Experiments
A series of tests was conducted to investigate component detachment on nickel-gold FPC boards. The methodology used visual inspection, mechanical testing, and microstructural analysis. Coating thickness measurement helped identify solder joint defects and plating issues.
Optical Microscope Observation
The surface-mounted FPC and the component drop-off locations on the failed samples were observed under an optical microscope (Nikon SMZ1000).
Thrust Test
Shear force tests followed the JIS Z3198-7:2003 chip solder joint method. Non-detached solder joints of failed samples were tested using a Dage4000 tensile shear tester.
Scanning Electron Microscopy and Energy Dispersive Spectroscopy
The sample surface microstructure was observed using a scanning electron microscope (SEM, Inspect F50). Surface composition was analyzed with an energy dispersive spectrometer (EDS, Apollo XP).
Coating Thickness Measurement
Coating thickness was measured following ASTM B568-98 using an X-ray fluorescence gauge (XRF, XDLM 237).
Results Analysis
The following section presents a detailed analysis of the failed FPC samples. Organization follows the previously described experimental methods. Methods include optical microscopy, mechanical shear testing, SEM/EDS analysis, and coating thickness measurement.
These analyses aim to identify the failure modes, characterize solder joint defects, and determine the relationship between plating quality and component detachment.
Optical Microscope Observations
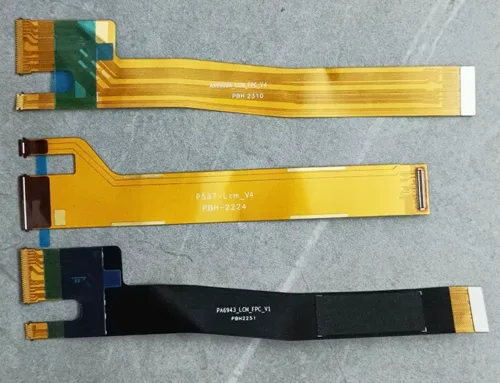
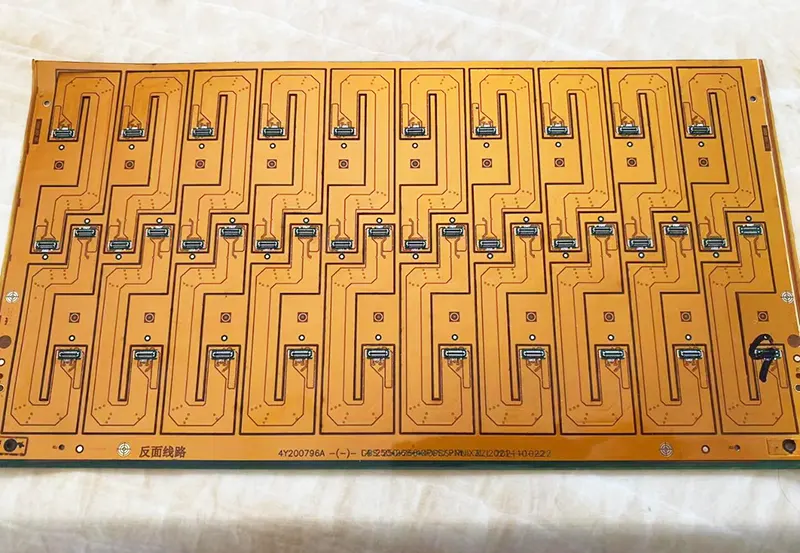
Figure 1 shows the FPC after surface mounting. A stereomicroscope examined the failure sample, and Figure 2 captures its appearance.
Figure 2 reveals that some components in the solder mask area have detached, with the FPC pad surface appearing reddish after component loss.

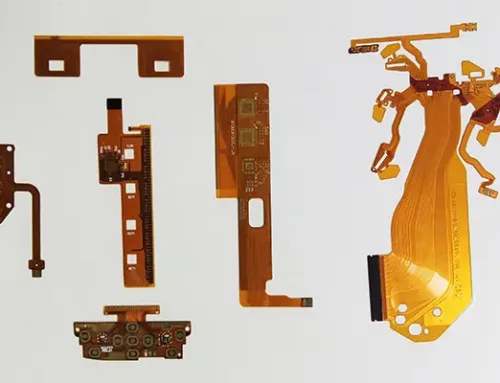
Figure 1 Flexible Printed Circuit Board After Surface Mount Assembly

Fig 2 Photograph of the location where the component fell off the failed sample
Thrust Test Results
Table 1 presents the thrust test results, and Figure 3 shows the test locations. Figure 4 depicts the appearance of the samples after thrust testing, as observed under a stereomicroscope.
Figure 4 shows that after the shear test, the FPC pad surface appears reddish, matching the color of the FPC pad surface after component detachment. The solderable terminals of the components appear grayish.

Table 1 Thrust Test Results

Fig 3 Shear test location on non detached solder joints of failed samples

Fig 4 Photograph of the sample after shear force testing
Scanning Electron Microscopy and Energy Dispersive Spectroscopy Analysis Results
Figure 5 presents the SEM and EDS analysis results of the FPC pad surface at the component detachment location on the failed sample.
Figure 5 shows the FPC pad surface is relatively smooth. Copper is the primary component, matching the color seen under the stereomicroscope.
This indicates that the fracture interface of the solder joint at the detachment location is located between the pad surface plating and the underlying copper.
The analysis detected no significant oxygen on the copper surface. This indicates copper oxidation did not cause solder joint fracture or component detachment.

Figure 5 SEM and EDS Results of the FPC Pad Surface at the Location of Component Detachment in the Failed Sample
> SEM and EDS Results After Shear Testing of Capacitor C1
After we performed shear force testing on capacitor C1 (which remained attached to the failed sample), Figure 6 shows the SEM and EDS analysis results of the FPC pad surface.
Figure 6 shows the pad surface is smooth. Copper is the primary component, with almost no nickel residue. This matches the failure observed at the component detachment site.
Figure 7 shows the SEM and EDS analysis results of the solderable terminal surface of capacitor C1. As seen in Figure 7, the primary component at this location is nickel.
This aligns with the color observations made under the stereomicroscope in the preceding text.
It indicates that the fracture interface of the solder joint after the shear force test is located between the nickel plating layer on the pad surface and the underlying copper.

Figure 6 SEM and EDS images of the pad surface after shear testing of capacitor C1

Figure 7 SEM and EDS images of the solderable terminal surface of capacitor C1 after thrust testing
> Cross-Section Analysis of the Undetected Resistor Joint
We prepared a cross-section of the solder joint from the undetected resistor on the failed sample, and Figure 8 shows its SEM image.

Figure 8 SEM image of the cross section of a resistive weld that did not detach from the failed product
Figure 8 reveals a uniform and continuous intermetallic compound (IMC) layer between the solder and the resistor’s solder pad, with a thickness ranging from approximately 0.816 to 1.340 μm. This indicates that the cause of solder joint cracking and component detachment did not originate from the SMT process.
However, a distinct gap exists between the nickel layer and the underlying copper, with a clean separation interface.
Plating Thickness
Table 2 presents the plating thickness test results, and they meet industry standards. This excludes the possibility of component detachment due to inadequate plating thickness.

Table 2 Coating Thickness Inspection Results
Failure Cause Analysis
Because the analysis detected no significant oxygen on the copper layer surface of the failed sample, oxidation of the copper foil surface did not cause the solder joint cracking or component detachment..
The intermetallic compound (IMC) layer between the solder and the resistor’s solder terminal was uniform and continuous, indicating that the cause of the solder joint cracking and component detachment did not originate from the SMT process.
The thicknesses of the nickel and gold plating layers met industry standards, ruling out the possibility of component detachment caused by inadequate plating thickness.
Therefore, the failure cause is more likely related to the bonding strength between the nickel plating layer on the pad and the underlying copper layer.
After shear testing, the primary component on the pad surface was copper, exhibiting surface morphology similar to the failed pad. The primary component on the device’s solder terminal surface was nickel.
This indicates that the solder joint separation interface also occurred between the pad’s nickel plating and the underlying copper, matching the failed interface. This confirms the low bond strength at this interface.
SEM cross-sectional images of non-detached resistors reveal a clean separation gap between the nickel layer and the underlying copper. This further confirms the poor adhesion between the nickel and copper layers, which ultimately caused the component detachment.
Conclusion
In summary, the primary cause of component detachment is the poor adhesion between the nickel plating layer and the underlying copper layer, evidenced by the presence of distinct gaps. Improper control of the electroplating process—such as failing to clean the surface before plating—primarily causes the weak bonding strength.