Understanding CAF Failure in Multilayer FPCBs: Mechanisms, Ion Migration, and Reliability Analysis
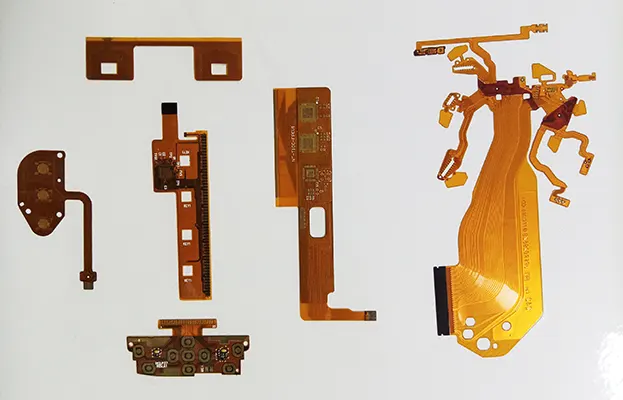
As printed circuit boards become increasingly multilayered and densely populated, demands for their reliability grow ever more stringent. Particularly with the multilayering of flexible printed circuits, engineers focus on product failures and malfunctions. Ion migration between different conductors causes these issues.
Electrical failures resulting from ion migration exhibit highly unstable failure latency periods, posing significant challenges for managing the entire product lifecycle and presenting substantial market risks.
Currently, stakeholders from material suppliers to PCB manufacturers and end-users are researching ion migration to ensure product reliability and stability.
Overview of CAF Failure
Conductive Anodic Filament (CAF) failures typically occur between holes, between holes and traces, or between traces.
Analyzing CAF-failed PCBs requires first identifying the location of the failure.
The current primary method involves stepwise segmentation to pinpoint the failure area and position. However, this approach is time-consuming and challenging to execute.
Furthermore, due to varying failure severity and locations, it often fails to identify the failure zone during analysis effectively.
The next step is determining the failure mode and type based on the product category.
CAF failure in rigid PCBs primarily occurs between holes. Conductive filaments grow along the resin-glass fiber interface within the insulation layer, forming distinct through-type pathways.
In contrast, CAF failure in FPCBs primarily occurs between conductors on the same layer, manifesting as conductive filaments formed by dendritic crystallization.
Mechanism of CAF Formation
CAF failure is the product of electrochemical migration (ECM) between networks.
Its mechanism involves copper ions migrating between anodes and cathodes under an electric field, continuously gaining or losing electrons.
After oxidation-reduction, these ions gradually deposit within the insulating medium between conductors.
PCBs develop elongated “through-channels” influenced by inner-layer glass fiber bundles.
In contrast, FPCBs exhibit irregular distribution of anions within the dielectric, leading to chaotic “dendritic growth” that migrates haphazardly from cathode to anode.
Both “through-paths” and “dendritic growths” reduce the insulation thickness between conductors while simultaneously forming current pathways, ultimately causing electrical performance failures in the product.
Challenges in Failure Analysis
Due to their thickness, layered structure, and failure modes, it is challenging to pinpoint specific failure locations in multilayer FPCBs.
A common scenario involves failures occurring in ion migration chambers, only to revert to normal upon retesting, severely hindering failure analysis and improvement efforts. The electrochemical reaction for CAF failure is illustrated in Figure 1.

Figure 1: Electrochemical reaction of CAF failure
This paper employs multiple analytical approaches to investigate CAF failures observed in multilayer FPCBs.
On one hand, it identifies methods and approaches for analyzing CAF failures in FPCBs; on the other, it investigates the failure modes and root causes of FPCB failures.
This provides a reference for subsequent CAF failure analysis and improvement in multilayer FPCBs.
Experimental Section
Laminate Design and Cell Design
Considering actual product design requirements and stack-up configurations, engineers designed the test samples identically.
Engineers employed blind via chains, with the chain configuration shown in Figure 2. Table 1 details specific via diameters and via pad dimensions.

Figure 2 Hole Chain Design Diagram
Table 1 Test Product Design Specifications
This board features a 3-layer 1+1+1 laminate structure. Each layer uses three sheets of *S05 copper-clad laminate with 25 μm polyimide (PI) thickness and 12 μm copper thickness.
The inner layer adhesive employs two sheets of 25X pure adhesive with 25 μm thickness (2 sheets), inner layer protective film using *15 protective film with PI thickness 12.5 μm and adhesive thickness 15 μm, and outer layer protective film using *20 protective film with PI thickness 12.5 μm and adhesive thickness 20 μm.
Figure 3 shows the specific laminate structure. Engineers manufactured it according to the production process flow for multilayer FPCBs.

Figure 3: Schematic diagram of the stacked structure of the test product
Test Method
The test method referenced in this document is IPC-TM 650 2.6.25, with the specific procedure as follows:
(1) Subject the substrate to two reflow soldering cycles, with the maximum reflow temperature set at (260±5) °C.
(2) Sample pretreatment: After 96 hours in an 85°C, 85% RH environment, the insulation resistance of the test sample must meet ≥100 MΩ.
(3) Technicians then place the samples in an 85°C, 85% RH environment with a bias voltage of 50 V and a test voltage of 100 V.
Technicians set the duration to 240 h, 500 h, and 1000 h, while monitoring and recording insulation resistance changes online.
Failure Criteria: Technicians deem test specimens with insulation resistance <100 MΩ as failed.
Test Results and Discussion
Test Results
Technicians tested nine specimens, all exhibiting initial insulation resistance >9,999 MΩ.The IR+Online@Bias voltage method confirmed insulation performance at each time interval.
Test results indicate that all specimens exhibited failure times exceeding 100 hours.
Table 2 summarizes specific test conditions and outcomes, while Figure 4 illustrates insulation resistance trends for each specimen.
Table 2: Summary of CAF Test Results

Figure 4. Trend of Insulation Resistance Variation
Failure Analysis
Analysis Approach
Table 3 Failure Analysis Steps
Analysis Results
> Identifying Failure Zones
Hotspot localization analysis precisely pinpointed specific failure points and locations within the samples. Notably, no large-area hotspots or failure zones were detected in the hotspot map due to:
① Ion migration channels have limited load capacity and may have been broken down during formation, resulting in no thermal activity during Hotspot analysis;
② Ion migration channels were not fully formed, resulting in non-conductive conditions during Hotspot testing and thus no heat generation. Both scenarios impacted insulation resistance control and constitute CAF failures.
> Cross-Section Examination
Cross-sectioning of hotspots identified by Hotspot analysis reveals, under backlight conditions, distinct brass-colored crystals in the adhesive layer of the coverlay (CVL) near inner layer pads, along with breakdown voids. See Table 4.
Table 4 Summary of Failure Specimen Cross-Sections
EDS analysis of failure site cross-sections revealed substantial metallic copper within the adhesive layer (AD) surrounding inner layer pads and between conductors across all three sample thicknesses (50, 70, 90 μm).
This copper constitutes the product of ion migration and is the primary cause of reduced insulation resistance.
Mapping distribution diagrams reveals dense, cloud-like distributions of metallic copper within the interlayer insulation (AD adhesive layer), exhibiting distinct variations in intensity.
These phenomena confirm ion migration occurring between inner-layer conductors, with migration pathways already formed. Ion migration patterns for each sample specification are illustrated in Figures 5–7.

Figure 5. SEM image of a 50 μm sample section, EDS Mapping analysis

Figure 6. SEM image of a 70 μm sample section, EDS Mapping analysis

Figure 7. SEM image of a 90 μm sample section, EDS Mapping analysis
FIB and Depth-Direction Ion Migration Analysis
To investigate longitudinal ion migration within the adhesive layer, FIB cutting was performed on the adhesive layer sections exhibiting ion migration.
EDS & mapping scans were conducted to confirm ion migration in the depth direction.
EDS results indicate significant amounts of metallic Cu detected within the cutting plane along the depth direction of the adhesive layer, confirming ion migration throughout the entire adhesive layer.
The mapping distribution reveals that the entire ion migration exhibits a cloud-like diffusion pattern, with reduced, crystallized, and deposited metallic Cu present across the entire cutting surface.
Ion migration is significantly present throughout the entire adhesive layer, with specific FIB and mapping analysis results shown in Figures 8 and 9.

Figure 8. FIB EDS Mapping analysis of 50 μm sample slices

Figure 9. FIB EDS Mapping analysis of a 70 μm sample section
Summary of Ion Migration Findings
Based on the above cross-section analysis, all failed specimens exhibited CAF phenomena with formed migration channels.
EDS and mapping results revealed that the AD layer within the inner CVL contained significant amounts of reduced and deposited metallic Cu.
No traces of ion migration were detected in the PI layer of the CVL or the PI layer of the flexible copper clad laminate (FCCL), as shown in Figure 10.

Figure 10 Schematic diagram of failure location
> Failure Analysis
The above analysis confirms that ion migration occurred within the AD layer of the inner CVL. This indicates the presence of ionic substances within the AD layer, which provided conditions for ion migration and resulted in dendritic crystallization.
Therefore, engineers must review the entire manufacturing process comprehensively. This includes conducting ion analysis on raw materials and during production to identify the source of ions.
(1) Ion Source Analysis.
Based on the principles and prerequisites of ion migration, process ion contamination data was concurrently collected during sample fabrication.
The AD layer of the CVL underwent Fourier transform infrared spectroscopy (FTIR) and X-ray fluorescence spectrometer (XRF) analysis.
The testing method followed IPC-TM-650 2.3.28 Ion Chromatography, with specific results shown in Figure 11.

Figure 11: Screenshot of the ion contamination test report
The ion chromatography analysis indicates that post-pre-stacking treatment, both Cl⁻ and SO₄²⁻ concentrations on the board surface are below control requirements, confirming no ionic contamination.
Calculations further reveal surface concentrations of 0.0826 μg/cm² for Cl⁻ and 0.0676 μg/cm² for SO₄²⁻.
Based on charge-to-mass ratio calculations, the migration velocity of SO₄²⁻ is 74% that of Cl⁻, indicating that SO₄²⁻ has a lesser impact on ion migration than Cl⁻.
Binder System Analysis
The primary binder system for the CVL used in this test was epoxy-based. Currently, mainstream CAF-resistant CVLs on the market primarily use acrylic-based binders.
The key distinction between the two, as revealed by FTIR analysis, is that the epoxy-based binder contains active hydrogen at the peak position of 3400 cm⁻¹, whereas the acrylic-based binder does not.
This active hydrogen facilitates ion migration, as shown in Figure 12.

Figure 12. CVL FTIR analysis spectra of different types
XRF spectra of the two CVL types reveal that the AD used in this study contains Cl−, whereas CAF-resistant CVLs are Cl−-free, as shown in Figure 13.

Figure 13. XRF spectra of different types of CVLs
The presence of Cl− provides a carrier for ion migration, making the product susceptible to this phenomenon.
The SGS ion chromatography test results for the CVL used in this study indicate a Cl⁻ concentration of 155 mg/kg, as shown in the test report screenshot in Figure 14. Calculations reveal a surface Cl⁻ content of 0.59 μg/cm².

Figure 14: Screenshot of SGS ion chromatography test report
The above testing and analysis show that the FPCB surface exhibits no ionic contamination following laminate pretreatment, thereby ruling out ion migration caused by surface ionic contamination.
Additionally, the surface Cl⁻ content in the AD layer of the CVL is 0.59 μg/cm², significantly higher than the 0.0826 μg/cm² on the FPCB surface.
Combined with its active hydrogen content, these ions and substances facilitate ion migration. This further indicates that the CVL may be the fundamental cause of ion migration failure.
(2) Analysis of Ion Migration Location Differences.
Cross-section images and mapping diagrams reveal that, over the same time period, ion migration between outer-layer conductors was less pronounced than between inner layers.
Researchers observed visible metallic copper deposition between inner layer pads, but not between outer layer pads.
Analysis revealed a difference in CVL adhesive thickness between the two locations: 15 μm for the inner layer and 20 μm for the outer layer, a 5 μm discrepancy.
Physical field simulations, as shown in Figure 15, reveal the following electric field strengths: – Inner layer PAD position 1: 2.221×10⁶ V/m – Inner layer PAD position 2: 2.27×10⁶ V/m while the outer layer PAD position 3 recorded 1.998×10⁶ V/m and PAD position 4 measured 2.022×10⁶ V/m.
The inner layer conductor positions exhibited approximately 10% higher electric field strength than the outer layer.
Due to this field intensity disparity, ion migration and electron gain/loss rates were significantly faster within the inner layer.

Figure 15 Simulation results of the physics field
The high-field location within the inner layer reduces Cu²⁺ to metallic Cu, forming whiskers.
The stronger discharge effect at the whisker tips further accelerates copper ion reduction and whisker growth, ultimately creating ion migration pathways within the inner layer dielectric.
Analysis Summary
Hotspot, cross-section, SEM, and FIB analysis tools identified the failure location and mode in this CAF test.
FTIR and XRF analysis identified the primary media and ions affecting CAF performance, ruling out potential ionic contamination during manufacturing.
Simultaneously, physical field simulations revealed that the disparity in ion migration between inner and outer layers primarily stems from higher electric field strength at inner conductor locations. The tip effect further accelerates ion migration rates.
Conclusions
Investigating CAF failure in FPCBs and analyzing the results lead to the following conclusions:
(1) CAF failure in FPCB products primarily occurs in adhesive layers, including interlayer bonding adhesives and protective film adhesives.
For products with stringent CAF performance requirements, controlling the CAF resistance of adhesives based on FCCL performance can be a key strategy.
(2) Utilizing tools such as Hotspot analysis, cross-sectioning, SEM, and FIB reveals the distribution morphology of copper ions following CAF failure within the adhesive layer.
This includes their migration locations, pathways, and states, establishing clear failure types and a comprehensive methodology for analyzing CAF failures.
This provides a reference for case studies of CAF failures in FPCB products.
(3) Ultimately, comprehensive CAF failure analysis combined with theoretical support from multi-physics field simulation established a methodology and framework for analyzing CAF failure (dendritic crystallization) in FPCB products.
This provides a reference for future CAF performance analysis and improvement.