High-Frequency Rigid-Flex PCB Manufacturing: Key Process Technologies Using PTFE Materials
With the advancement of information technology, higher demands have been placed on the efficient and stable transmission of electrical signals, driving continuous upgrades in high-frequency materials. Influenced by market needs, the application and research of FPC in high-frequency fields lag behind that of PCB.
Currently, the primary high-frequency materials used in FPCs are MPI, LCP, and PTFE.
Among these, PTFE exhibits the lowest loss factor (Df < 0.002 @ 10 GHz), meeting the insertion loss testing requirements for higher frequencies.
As shown in Figure 1, this paper compiles the common high-frequency materials currently used in the FPC industry, including base materials and auxiliary materials (cover films and pure adhesives).

Figure 1. High-frequency material spectrum
As a significant PCB product type, rigid-flex boards combine the stability of rigid boards with the flexibility of flexible boards, effectively saving internal product space.
With rising high-frequency demands, the development trend of high-frequency rigid-flex boards is also gradually increasing.
Based on a high-frequency ten-layer RIGID-FLEX board, this paper shares key process technologies, including material testing, lamination, drilling, and plasma treatment, providing a reference for manufacturing high-frequency multilayer RIGID-FLEX boards.
Product Overview
This ten-layer product features flexible zones from L2 to L9. Both the flexible zone substrate (customer-supplied) and the pure adhesive bonding sheets (BS) FR-**Z are PTFE-based high-frequency materials.
Key design specifications, laminate information, and material details are summarized in Table 1.
| Design Item | Technical Requirement |
|---|---|
| Material | FR-**Z (BS) |
| Number of Flex Layers | 8 L |
| Total Layer Count | 10 L |
| Finished Board Thickness | 1.7 ± 0.075 mm |
| Minimum Hole Diameter | 0.2 mm |
| Maximum Aspect Ratio | 8:1 |
| Layer Misalignment | ≤ 0.15 mm |
| Resin Overflow | ≤ 0.5 mm |
| Impedance Tolerance | ±10% |
Table 1 Key Product Design Specifications

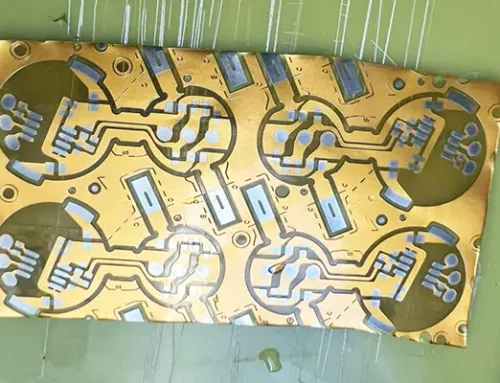
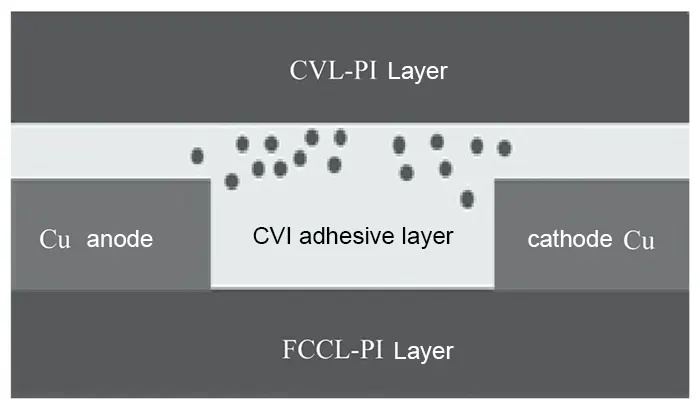
Figure 2 Product Stacking Information Diagram

Figure 3: FR-**Z Material Laminate Schematic
Product Process Flow:
Cutting → Drilling → Inner Layer Pattern 1 → Inner Layer Etching 1 → Inner Layer AOI 1 → Brown Coating → Lamination 1 → Drilling → Plasma → Electroplating Copper → Electroplating → Inner Layer Pattern 2 → Inner Layer Etching 2 → Inner Layer AOI 2 → Cover Film Lamination → Brown Coating (Completion of Flexible Area) → Laminate 2 → Drilling → Plasma → Electrolytic Copper Plating → Electroplating → Outer Layer Pattern → Outer Layer Etching → Outer Layer AOI → Solder Mask → Controlled Depth Milling → Cover Removal → Gold Plating → Characterization → Forming → Electrical Testing → OSP → FQC → FQA → Shipping
Key Process Technologies
Base Material Testing
The substrate used in this product is supplied by the customer, with a PTFE resin system.
Based on PCB experience, different suppliers have varying perspectives on the self-healing properties of PTFE.
Company R states its PTFE material shows no significant self-healing over time, while Company S reports noticeable self-healing within 16 hours.
Therefore, we prioritized evaluating this material’s self-healing capability to facilitate subsequent production control.
Test Method: Core boards were cut into 20 × 20 cm test panels. One side of each panel was etched.
Surface morphology was characterized using SEM at different time intervals. Two panels were then laminated together and subjected to peel strength testing.
Test results are shown in Table 2. Within 48 hours, PTFE exhibited slight self-healing with minimal overall variation.
Tensile strength decreased slightly over time, but remained compliant within 48 hours (tensile strength > 4 lb/in).

Table 2: PTFE Self-Healing Ability Test
During testing, it was observed that minor surface compression of the substrate caused significant collapse of the honeycomb structure retained after copper etching.
This collapse could not be restored via plasma treatment, and severely impaired tensile strength testing.
› Process Control Recommendations
Tensile values fell below 1 lb/inch, as shown in Figure 4. Therefore, the following processing recommendations are proposed:
(1) Increase copper plating coverage in non-functional areas to protect the substrate surface;
(2) Control the time from etching to lamination and from etching to solder mask application within 48 hours.

Figure 4. SEM images of the substrate surface after extrusion, SEM images after Plasma treatment, and tensile test results.
Pressing
This product involves two pressing operations: first pressing L2-L9 (flex zone pressing), followed by pressing L1-L10 (full board pressing). These are discussed separately below.
› Flex Zone Pressing
(1) Laminating Parameters.
Laminating parameter design primarily follows the FR-**Z processing guidelines (as shown in Table 3), with subsequent adjustments based on laminating results and production efficiency.
According to the processing guidelines, the design of the laminating process focused on the following two points:
① **FR-Z Lamination Curing Conditions and Processing Parameters
The FR-**Z processing guidelines provide a comparison of two curing conditions, with the material temperature curves shown in Figure 5.
Testing revealed that both curing conditions yield comparable lamination results for the material, both meeting thermal stress test requirements (288°C tin immersion for 10 seconds, repeated 3 times).
Curing Condition 1 requires a shorter processing time, reducing the total duration by approximately 1 hour compared to Condition 2. Therefore, Condition 1 parameters are prioritized.
(Note: Actual material temperature curves may exhibit deviations in heating rate, pressure transition point, curing time, and cooling rate due to uncontrollable variables. However, these remain within the processing reference range and thus are not subject to further scrutiny here.)
| Item | Parameter |
|---|---|
| Curing Condition 1 | 215 °C, 60 min |
| Curing Condition 2 | 200 °C, 150 min |
| Pressure | 100–200 psi |
| Pressure Transition Point | 70–90 °C |
| Heating Rate (80–150 °C) | 2–4 °C/min |
| Cooling Rate | < 3 °C/min |
Table 3 FR-**Z Laminating Processing Guide

Figure 5. Temperature curve of the pressed material
② Effect of Lamination Pressure on PTFE Film Flatness
The reference pressure for FR-**Z is 100–200 psi, which differs significantly from conventional BS lamination parameters (typically around 450 psi).
To address this, we compared lamination results at 100 psi and 200 psi (as shown in Figure 6).
Test results indicate: At 100 psi, the PTFE film in the FR-**Z interlayer lays flat effectively.
At 200 psi, significant wrinkling occurs in the PTFE film. Such wrinkling causes signal frequency deviation at high frequencies.

Figure 6. Comparison of pressing effects at 100 psi and 200 psi.
(2) Laminating Stackup.
Different lamination stackups directly impact the conformality of the substrate.
Comparing the lamination results of two stackups (as shown in Figure 7), stackup a consists of: steel plate + release liner + FPC + release liner + steel plate; stackup b consists of: steel plate + kraft paper + PE film + release liner + FPC + release liner + PE film + kraft paper + steel plate.
Testing revealed that adding buffer material significantly improved adhesive filling.
This occurs because the buffer material equalizes pressure across high and low-pressure zones during lamination.

Figure 7. Effects of different pressing and lamination structures
› Outer Layer Laminating
Outer layer laminating primarily evaluates adhesive overflow. This product requires an overflow ≤ 0.5 mm.
Excessive overflow compromises sheet bendability and bending life while increasing lid removal difficulty.
To control adhesive overflow, a low-flow pre-preg (low-flow PP) is typically selected between the flexible and rigid layers.
Due to the required thickness of the dielectric layer, this product design incorporates two layers of low-flow PP.
Using the conventional PP windowing method resulted in excessive adhesive overflow at the rigid-flex interface after lamination (as shown in Figure 8a), with overflow reaching 0.7 mm.

Figure 8. Actual photo of the overflowing adhesive.
Based on this, a layer of high-temperature tape was applied to the corresponding surface area of the FPC before lamination (as shown in Figure 9) to block adhesive flow during the process.
The alignment points for the high-temperature tape were designed within the FPC’s inactive zone, allowing the tape to be removed after peeling.
After applying the high-temperature tape, the adhesive overflow was significantly reduced.
Visually, almost no overflow was observed (as shown in Figure 8b), with minor overflow instances remaining below 0.3 mm, meeting product requirements.

Figure 9. Schematic diagram of high-temperature tape application
Drilling
The substrate layer of this product incorporates multiple material types (FR4, PTFE, ADH, PI), each requiring distinct drilling parameters. Therefore, establishing a suitable set of drilling parameters is critical.
Among these materials, PTFE is a thermoplastic resin that tends to produce filamentous chips during drilling, which easily adhere to the hole walls, leading to a series of quality defects.
Therefore, drilling parameters for PTFE must be prioritized (Note: The PTFE material used in this product contains no glass fiber but includes ceramic fillers).
This study primarily investigates the effects of three factors—rotational speed (S), feed rate (F), and retraction speed (R)—on drilling quality.
› Orthogonal Experiment Design
Each factor was designed with three levels to establish an orthogonal test.
The test conditions are shown in Table 4, and the test factors and levels are listed in Table 5.
| Item | Content |
|---|---|
| Hole Diameter | 0.2 mm |
| Board Thickness | 1.6 mm |
| Entry Board | 0.5 mm Phenolic Entry Board |
| Backup Board | 1.5 mm Phenolic Backup Board |
| Stack Configuration | One panel per stack |
| Tool Life Limit | 400 hits |
| Holes per Panel | 25 |
| Evaluation Defect | Hole Wall Roughness |
Table 4 Orthogonal Drilling Test Conditions
| Level | Factor A: S (krpm) | Factor B: F (IPM) | Factor C: R (IPM) |
|---|---|---|---|
| 1 | 140 | 65 | 500 |
| 2 | 110 | 50 | 400 |
| 3 | 80 | 35 | 300 |
Table 5 Orthogonal Test Factors and Levels
The results of the orthogonal test are shown in Table 6, where the hole roughness data represent average values.
Comparing the range R, the primary and secondary influence order of factors on hole roughness for this product is S > F > R.
Comparing the K values, the optimal combination across all tests is S3F1R2.
Test results indicate that the optimal hole configuration combines low rotational speed with high feed rate, reducing copper buildup and inner-layer interconnect defects (ICD).
This is because PTFE softens under heat; the low-speed, high-feed approach slows drill bit heating, facilitating PTFE drilling.
Plasma Treatment
Plasma treatment comprises two stages: de-gumming and activation. Due to PTFE’s material properties, chemical and plasma de-gumming are typically ineffective.
Thus, de-gumming primarily removes residual ADH, PI, and FR4 from hole walls.
Optimal de-gumming parameters are critical: insufficient removal causes defects like ICD, while excessive removal leads to wicking issues.
Temperature and time are critical parameters for plasma de-gumming.
This product references the processing guidelines for FR-**Z and combines them with the capabilities of the plasma equipment to test different combinations of these two parameters.
› Orthogonal Test and Results
The test results are shown in Table 7. Based on the test results, it can be observed that both increasing temperature and extending time increase the amount of gum removed.
To meet hole copper reliability requirements, BS etching is typically controlled between 5–25 μm. Based on this, the selected resin removal parameters for this product are 60°C temperature and 15 min duration.
| No. | Factor A | Factor B | Factor C | Hole Roughness (μm) |
|---|---|---|---|---|
| 1 | 1 | 1 | 1 | 19.5 |
| 2 | 1 | 2 | 2 | 18.3 |
| 3 | 1 | 3 | 3 | 19.1 |
| 4 | 2 | 3 | 2 | 19.3 |
| 5 | 2 | 2 | 1 | 18.6 |
| 6 | 2 | 1 | 3 | 17.5 |
| 7 | 3 | 1 | 2 | 14.5 |
| 8 | 3 | 2 | 3 | 16.2 |
| 9 | 3 | 3 | 1 | 17.4 |
Table 6 Orthogonal Test Results

Table 7 Plasma Resin Removal Parameter Test Data and Results
› Plasma Surface Activation
Due to PTFE’s inherently low surface properties, it exhibits poor adhesion, hydrophilicity, and wettability, making it difficult for materials like metals to bond to its surface.
Therefore, surface modification is required, with plasma activation being a common method.
Following processing guidelines, pure helium was selected for activation.
Specific plasma parameters are detailed in Table 8. The final finished copper-filled via cross-section is shown in Figure 10.
| Step | Function | Power | Gas | Temperature | Time | Pressure |
|---|---|---|---|---|---|---|
| 1 | Heating | 3.5 kW | O₂: 2.50 L/min | 45 °C | 10 min | 250 mTorr |
| 2 | Resist Removal | 4.0 kW | O₂: 2.15 L/minN₂: 0.20 L/minCF₄: 0.15 L/min | 60 °C | 15 min | 250 mTorr |
| 3 | Activation | 4.0 kW | He: 1.00 L/min | 60 °C | 15 min | 250 mTorr |
| 4 | Cleaning | 3.5 kW | N₂: 2.00 L/min | 50 °C | 5 min | 250 mTorr |
Table 8 Plasma Parameter Table

Figure 10. Finished copper cross-section diagram
Conclusion
This paper describes the processing technology for critical steps in manufacturing a ten-layer high-frequency rigid-flex board, encompassing material testing, lamination, drilling, and plasma treatment. Key test results are summarized below:
(1) Protect substrate surfaces post-etching to prevent compression; complete lamination within 48 hours.
(2) Follow material processing guidelines for lamination parameters; select appropriate buffer materials to ensure lamination reliability.
(3) Apply high-temperature tape to lid removal areas to block resin flow and minimize resin overflow.
(4) Employ low spindle speed with high feed rate for drilling to enhance hole wall integrity.
(5) Plasma stripping parameters must prevent adhesive residue and excessive etching; use pure helium for activation.
These conclusions are based on single-product testing and have inherent limitations.
However, they broadly align with processing requirements for similar products and aim to provide engineers with reference values for manufacturing high-frequency rigid-flex boards.