Enhancing FPC Insulation Performance in Ultra-Long Thick Copper Flexible Circuits
Flexible printed circuit boards (FPCs) have gained widespread adoption in consumer electronics, new energy vehicles, aerospace, and medical equipment due to their lightweight, bendable nature, and high integration capabilities.
As electronic devices evolve toward higher power and density, demand for ultra-long, thick copper FPCs is growing to meet requirements for high current-carrying capacity and efficient heat dissipation.
However, thick copper FPCs are prone to failures such as insulation breakdown and interlayer delamination under high-voltage, high-temperature, and complex mechanical stress conditions, severely compromising their reliability and service life.
Therefore, enhancing the insulation performance of ultra-long, thick copper FPCs has become a key research challenge.
Currently, the insulation performance of FPCs primarily relies on the selection of dielectric materials and optimization of manufacturing processes.
This study aims to provide theoretical guidance and technical solutions for enhancing the insulation performance of ultra-long, thick copper FPCs.
It seeks to advance their reliable application in fields such as new energy vehicle battery management systems and high-power power electronics, while also offering a reference for designing flexible electronic devices under extreme conditions in the future.
Analysis of Insulation Failure Causes
Analysis of the Dielectric Layer
During high-voltage testing or insulation resistance (IR) measurement, the insulation resistance of the dielectric layer exhibits a rising trend over time, typically peaking within tens of seconds.
This behavior contradicts the stable resistance characteristic of conventional insulating materials, which should plateau or decrease slightly.
Insufficient dielectric layer thickness—such as falling below design specifications—can trigger the following issues, leading to abnormal increases in insulation resistance:
(1) Excessive Electric Field Strength:
When the dielectric layer is too thin, the electric field strength under the same test voltage significantly increases, approaching the critical breakdown field strength of the dielectric material, as shown in Equation 1.
E = v/d
Where:
E: Electric field strength (Unit: kV/mm),
v: Applied voltage (Unit: V),
d: Dielectric layer thickness (Unit: mm).
Physical manifestation: It indicates the voltage borne by a unit thickness of dielectric material, directly reflecting the electrical stress borne by the dielectric.
Initial manifestation: High electric fields cause ionization of trace-free ions or impurities within the dielectric, generating minute leakage currents and resulting in low resistance values.
Later manifestation: Ionized charges accumulate at the dielectric/copper foil interface, forming a reverse polarization electric field that counteracts the test voltage, causing resistance values to exhibit an upward trend.
(2) Interface Charge Injection and Accumulation:
Thin dielectric layers cannot effectively block charge injection from copper foil into the dielectric layer, particularly under high-frequency or high-voltage conditions.
Charge accumulates within the dielectric or at the interface, causing space charge effects. Insulation resistance increases over time, resembling a “self-healing” phenomenon.
(3) Partial Discharge Phenomena:
Excessively thin dielectric layers may trigger localized micro-discharges, such as tip discharges caused by copper foil roughness.
Residual particles from discharges temporarily enhance insulation performance, manifesting as increased insulation resistance.
Trace Width and Spacing Analysis
Trace width and spacing directly impact FPC insulation performance, primarily through the following mechanisms:
Uneven Electric Field Distribution: When spacing is too narrow or trace widths vary excessively, electric fields become highly concentrated between adjacent conductors (especially at edges).
This causes localized field strengths to exceed the dielectric’s tolerance, leading to insulation degradation, as shown in Equation 2.

Where E1 is the edge field strength (unit: kV/mm), v is the applied voltage (unit: V). Smaller line spacing results in higher edge field strength.
Analysis of Defective Physical Samples
(1) Insulation Resistance Instability
Based on the customer’s original design specifications, the flexible board used a 50 μm cover film and 35 μm copper thickness. Statistical analysis of insulation resistance data was conducted for ultra-long thick-copper FPCs with electromagnetic shielding film.
The measurement was performed using an insulation resistance tester.
The results showed that the insulation resistance reached a peak of 5000 MΩ with a slow upward trend. It failed to meet the customer’s specified peak time requirement of 10–18 seconds.
Furthermore, it could not maintain a constant resistance value over time or reach the peak, as shown in Figure 1. After a certain period, the insulation resistance exhibited a downward trend, with statistical data presented in Figure 2.

Figure 1. Measurement diagram of the insulation tester

Figure 2. Data analysis of the insulation resistance measuring instrument
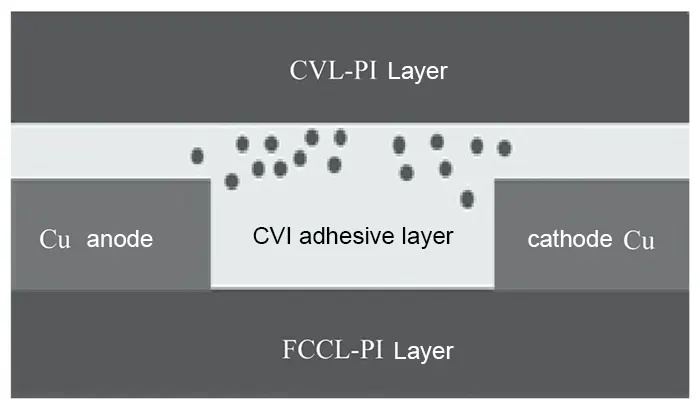
(2) Critical Interlayer Dielectric Thinning at Cover Film Window Edges
Analysis confirmed the interlayer dielectric thickness at the windowed position of the cover film (as shown in Figure 3).
After laminating the flexible board with 50 μm cover film and electromagnetic film (base insulation layer 8–10 μm), the two edge sections of the circuit measured 4.48–10.44 μm and 0–15 μm, respectively.

Figure 3. Medium slice diagram
(3) Insufficient Dielectric Thickness Causing Insulation Resistance Failure
Dielectric Standard: Due to excessive thinness in the vertical direction, preliminary analysis indicates that the electromagnetic shielding film’s conductive layer reduced insulation resistance. Referencing industry dielectric standards (as shown in Figure 4):
For solder mask B4, the minimum vertical direction insulation resistance is 100 V, requiring a dielectric thickness of 130 μm.
Consequently, the dielectric thickness after lamination with the electromagnetic shielding film is insufficient to meet insulation resistance requirements.
| Conductor Voltage (DC or AC Peak) | B1 | B2 | B3 | B4 | A5 | A6 | A7 |
|---|---|---|---|---|---|---|---|
| 0–15 | 0.05mm [0.00197in] | 0.1mm [0.0039in] | 0.1mm [0.0039in] | 0.05mm [0.00197in] | 0.13mm [0.00512in] | 0.13mm [0.00512in] | 0.13mm [0.00512in] |
| 16–30 | 0.05mm [0.00197in] | 0.1mm [0.0039in] | 0.1mm [0.0039in] | 0.05mm [0.00197in] | 0.13mm [0.00512in] | 0.25mm [0.00984in] | 0.13mm [0.00512in] |
| 31–50 | 0.1mm [0.0039in] | 0.6mm [0.024in] | 0.6mm [0.024in] | 0.13mm [0.00512in] | 0.13mm [0.00512in] | 0.4mm [0.016in] | 0.13mm [0.00512in] |
| 51–100 | 0.1mm [0.0039in] | 0.6mm [0.024in] | 1.5mm [0.0591in] | 0.13mm [0.00512in] | 0.13mm [0.00512in] | 0.5mm [0.020in] | 0.13mm [0.00512in] |
| 101–150 | 0.2mm [0.0079in] | 0.6mm [0.024in] | 3.2mm [0.126in] | 0.4mm [0.016in] | 0.4mm [0.016in] | 0.8mm [0.031in] | 0.4mm [0.016in] |
| 151–170 | 0.2mm [0.0079in] | 1.25mm [0.0492in] | 3.2mm [0.126in] | 0.4mm [0.016in] | 0.4mm [0.016in] | 0.8mm [0.031in] | 0.4mm [0.016in] |
| 171–250 | 0.2mm [0.0079in] | 1.25mm [0.0492in] | 6.4mm [0.252in] | 0.4mm [0.016in] | 0.4mm [0.016in] | 0.8mm [0.031in] | 0.4mm [0.016in] |
| 251–300 | 0.2mm [0.0079in] | 1.25mm [0.0492in] | 12.5mm [0.492in] | 0.4mm [0.016in] | 0.4mm [0.016in] | 0.8mm [0.031in] | 0.8mm [0.031in] |
| 301–500 | 0.25mm [0.00984in] | 2.5mm [0.0984in] | 12.5mm [0.492in] | 0.8mm [0.031in] | 0.8mm [0.031in] | 1.5mm [0.0591in] | 0.8mm [0.031in] |
| > 500 (See Section 6.3 for calculation) | 0.0025mm/volt | 0.005mm/volt | 0.025mm/volt | 0.00305mm/volt | 0.00305mm/volt | 0.00305mm/volt | 0.00305mm/volt |
B1 – Internal conductor
B2 – External conductor, uncoated, sea level to 3050m [10,007ft]
B3 – External conductor, uncoated, above 3050m [10,007ft]
B4 – External conductor, permanent polymer coating (any altitude)
A5 – External conductor, component lead with conformal coating (any altitude)
A6 – External component lead/termination, uncoated, sea level to 3050m [10,007ft]
A7 – External component lead/termination, with conformal coating (any altitude)
Project Planning
Key Technical Capability Plan Metrics
This product is an ultra-long, ultra-thick copper layer, high-reliability flexible printed circuit board (FPC).
The product utilizes high-performance composite dielectric materials and optimized processes. It significantly enhances insulation performance. It is suitable for high-voltage, high-current, and high-temperature environments. Product processing parameters are shown in Table 1.
| No. | Feature Name | Technical Parameter |
|---|---|---|
| 1 | Number of Layers | 2L |
| 2 | Etched Circuit | ±10% |
| 3 | Finished Copper Thickness | 70 μm |
| 4 | Finished Hole Copper | 35 μm |
| 5 | Overall Dimensions | 3394.74×20 mm ±0.2 mm |
| 6 | Insulation Resistance | Reach 5000 MΩ within 10 s, and stabilize at 5000 MΩ |
Experimental Materials
To manufacture ultra-long, thick copper FPCs with 15 μm EMI shielding film, the production process requires a composite material consisting of a 50 μm thick substrate dielectric and a 100 μm thick PI cover film (PI + modified epoxy resin).
This substrate is combined with 35 μm rolled copper foil, which undergoes horizontal copper plating + electroplating to achieve a final copper thickness of 70 μm.
The finished product requires a three-electrode test fixture and an insulation resistance tester for operation within a constant temperature and humidity test environment.
Key experimental materials are listed in Table 2.
| Material Name | Material Properties | Remarks |
|---|---|---|
| Copper-Clad Laminate | PI thickness: 50 μmCopper foil type: 35 μm rolled copper | Polyimide (PI) + modified epoxy resin composite material |
| EMI Electromagnetic Shielding Film | Thickness: 18 μm | High-resistance shielding material, surface resistance > 10⁶ Ω, nano carbon film |
| PI Coverlay Film | Coverlay thickness: 100 μm | Polyimide (PI) |
| Insulation Resistance Tester | Measurement range (Test voltage: 500 V; Insulation resistance value: 5000 MΩ) | Three-electrode test fixture, tested under constant temperature and humidity conditions |
| UV Laser Machine | Extra-long platform | Applicable length ≥ 2 m |
Experimental Procedure
Following the established key technical capability plan metrics, corresponding processes undergo experimental testing to determine optimal process parameters.
Experimental procedures are defined for multiple process segments. These segments include segmented drilling and horizontal electroplating plus plating. They also include exposure etching.
They include laminating the cover film and electromagnetic shielding film with rapid pressing. They further include UV laser cutting. They conclude with finished product insulation testing, as shown in Figure 5.

Figure 5 Experimental Flowchart
Research on Enhancing Insulation Performance of Ultra-Long Thick Copper FPC
Influence of PI Thickness, Line Width, and Line Spacing on Insulation Performance
To address the aforementioned issues, this paper proposes an improvement scheme for insulation defects in ultra-long, thick copper FPC.
Thin dielectric layers, uneven copper foil thickness, lamination process defects, and charge-discharge phenomena occur as key factors.
These factors often lead to unstable insulation resistance. They also reduce voltage withstand performance and severely impact product lifespan.
This study systematically explores insulation performance optimization for ultra-long thick copper FPCs through three key approaches: material modification, process optimization, and structural design.
» Experimental Design
(1) Effect of different PI thicknesses on insulation resistance;
(2) Effect of different line spacing designs on insulation resistance;
(3) Effect of different cover film thicknesses on insulation resistance.
» Test Data
(1) Data for different flexible board PI thicknesses are shown in Table 3.
| Experimental Group | Level Factor | Flexible Board PI Thickness |
|---|---|---|
| 1 | A1 | 0.05 mm |
| 2 | A2 | 0.076 mm |
| 3 | A3 | 0.1 mm |
| 4 | A4 | 0.125 mm |
(2) Data for different line spacing designs are shown in Table 4.
| Experimental Group | Level Factor | Line Spacing |
|---|---|---|
| 1 | B1 | 0.2 mm |
| 2 | B2 | 0.4 mm |
| 3 | B3 | 0.6 mm |
| 4 | B4 | 0.8 mm |
(3) Data for different cover film thicknesses are shown in Table 5.
| Experimental Group | Level Factor | Coverlay Thickness |
|---|---|---|
| 1 | C1 | 37.5 μm |
| 2 | C2 | 50 μm |
| 3 | C3 | 62.5 μm |
| 4 | C4 | 100 μm |
» DOE Experimental Data
Sample fabrication was completed through 16 experiments.
For each experimental group, the impact of flexible board PI thickness, varying line widths, and cover film thickness on insulation resistance was recorded in the DOE experiment log.
All data were based on 60-second insulation resistance test results. The scoring criterion was: shorter peak time resulted in higher scores (Score = 100 − Peak Time), as shown in Table 6.
» Test Data Analysis
(1) Impact of PI Thickness, Line Spacing, and Cover Film on Insulation Performance
This experiment employed a three-factor, four-level orthogonal test design to examine the impact of the following key factors on insulation performance:
Flexible board PI thickness (four levels: A1–A4), different line spacings (four levels: B1–B4), and cover film thickness (four levels: C1–C4).
Statistical analysis of the DOE experimental data table for factor levels, comprehensive scores, and range revealed the following factor influence ranking:
Factor A (range 120) > Factor C (range 94) > Factor B (range 74). Soft board PI thickness had the most significant impact on insulation performance.
(2) Optimal Level Combination:
Theoretical Optimum: A3B4C4 (highest overall comparative score).
However, since A3 represents a soft board PI thickness of 0.1 mm plus 75 μm copper thickness in the finished product, it fails to meet the customer’s bending cycle requirements.
(3) Optimal FPCB Scheme Evaluation and Insulation Performance Limitations
Overall comparison indicates the optimal scheme is A2B3C4 (highest single-item comparative score).
However, the insulation resistance value requires 3 seconds to reach its peak, still failing to fully satisfy customer needs.
Item Type | Experiment No. | A (Soft PI Thickness) | B (Line Spacing) | C (Coverlay Thickness) | Test Result | Score |
|---|---|---|---|---|---|---|
| Experiment | 1 | A1 | B1 | C1 | Insulation resistance value 60 Ω reaches standard | 40 |
| Experiment | 2 | A1 | B2 | C2 | Insulation resistance value 54 Ω reaches standard | 46 |
| Experiment | 3 | A1 | B3 | C3 | Insulation resistance value 47 Ω reaches standard | 53 |
| Experiment | 4 | A1 | B4 | C4 | Insulation resistance value 36 Ω reaches standard | 64 |
| Experiment | 5 | A2 | B1 | C2 | Insulation resistance value 57 Ω reaches standard | 43 |
| Experiment | 6 | A2 | B2 | C1 | Insulation resistance value 60 Ω reaches standard | 40 |
| Experiment | 7 | A2 | B3 | C4 | Insulation resistance value 2 Ω reaches standard | 98 |
| Experiment | 8 | A2 | B4 | C3 | Insulation resistance value 3 Ω reaches standard | 97 |
| Experiment | 9 | A3 | B1 | C3 | Insulation resistance value 20 Ω reaches standard | 80 |
| Experiment | 10 | A3 | B2 | C4 | Insulation resistance value 16 Ω reaches standard | 84 |
| Experiment | 11 | A3 | B3 | C1 | Insulation resistance value 30 Ω reaches standard | 70 |
| Experiment | 12 | A3 | B4 | C2 | Insulation resistance value 11 Ω reaches standard | 89 |
| Experiment | 13 | A4 | B1 | C4 | Insulation resistance value 32 Ω reaches standard | 68 |
| Experiment | 14 | A4 | B2 | C3 | Insulation resistance value 20 Ω reaches standard | 80 |
| Experiment | 15 | A4 | B3 | C2 | Insulation resistance value 8 Ω reaches standard | 92 |
| Experiment | 16 | A4 | B4 | C1 | Insulation resistance value 30 Ω reaches standard | 70 |
| Comprehensive Score | — | (A1) 203 | (B1) 231 | (C1) 220 | / | / |
| Comprehensive Score | — | (A2) 278 | (B2) 246 | (C2) 270 | / | / |
| Comprehensive Score | — | (A3) 323 | (B3) 313 | (C3) 310 | / | / |
| Comprehensive Score | — | (A4) 310 | (B4) 320 | (C4) 314 | / | / |
| Range (Extreme Difference) | — | 120 | 74 | 94 | / | / |
| Optimal Solution | — | A3 | B4 | C4 | / | / |
| Recommended Solution | — | A2 | B3 | C4 | / | / |
Test Summary
Through DOE testing, soft board PI thickness was identified as the primary factor influencing insulation resistance. However, the insulation resistance values across the 16 test experiments did not exhibit a regular upward trend (as shown in Figure 6).

Figure 6. Trend chart of time required for each group of experiments to reach the peak value.
Effects of FPC Length and Electromagnetic Shielding Film on Insulation Resistance
Shielding films typically contain conductive layers (e.g., aluminum foil/conductive adhesive), forming leakage pathways that reduce insulation resistance and alter electric field distribution.
As product length increases, charging and discharging phenomena become more severe, impacting insulation performance.
This study investigates the influence of two factors—FPC length and electromagnetic shielding film—on insulation properties.
» Experimental Design
(1) Experimental Design for FPC Length and Windowed Cover Film Effects on Insulation Performance
Based on the optimal experimental scheme (A2B3C4) described above, design experiments to evaluate the impact of varying FPC lengths on insulation performance.
Additionally, design experiments to assess the effect of applying a windowed cover film without electromagnetic shielding film on insulation resistance, as shown in Table 7.
(2) Post-Etching Inspection and Insulation Resistance Evaluation
Post-etching inspection of semi-finished products: After etching, test performance was evaluated using a multimeter and flying probe tester to confirm whether post-etching insulation resistance could instantly reach peak values, as shown in Table 8.
Table 8 Experimental Comparison Table
(3) Data Analysis.
As shown in Table 9, experimental data comparison indicates that altering FPC length yields improved results: shorter FPC lengths result in faster insulation value rise times.
As shown in Table 10, experimental data compares the original design’s electromagnetic shielding film grounding position with and without the film applied.
The data reveal that products without the electromagnetic shielding film reach peak values faster than those with it.
| Experimental Group | Length (m) | Number of Tests (Sets) | Average Time to Reach Peak (s) | Insulation Pass Rate (%) |
|---|---|---|---|---|
| 1 | 0.5 | 10 | 0 | 100 |
| 2 | 1 | 10 | 4 | 98 |
| 3 | 2 | 10 | 13 | 95 |
| 4 | 3 | 10 | 20 | 88 |
| 5 | 4 | 10 | 26 | 80 |
| 6 | 3.39474 (Customer Size) | 10 | 16 | 89 |
Table 9
| Experimental Group | Length (m) | Design | Number of Tests (Sets) | Average Time to Reach Peak (s) | Insulation Pass Rate (%) |
|---|---|---|---|---|---|
| 1 | 0.5 | Without EMI Shielding Film | 10 | 0 | 100 |
| 1 | 0.5 | With EMI Shielding Film | 10 | 0 | 100 |
| 2 | 1 | Without EMI Shielding Film | 10 | 1 | 98 |
| 2 | 1 | With EMI Shielding Film | 10 | 4 | 95 |
| 3 | 2 | Without EMI Shielding Film | 10 | 4 | 95 |
| 3 | 2 | With EMI Shielding Film | 10 | 13 | 95 |
| 4 | 3 | Without EMI Shielding Film | 10 | 6 | 93 |
| 4 | 3 | With EMI Shielding Film | 10 | 20 | 88 |
| 5 | 4 | Without EMI Shielding Film | 10 | 8 | 95 |
| 5 | 4 | With EMI Shielding Film | 10 | 26 | 85 |
| 6 | 3.39474 (Customer Size) | Without EMI Shielding Film | 10 | 7 | 93 |
| 6 | 3.39474 (Customer Size) | With EMI Shielding Film | 10 | 16 | 88 |
Table 10
» Test Summary
(1) Effect of FPC Length on Insulation Performance:
Short lengths ≤0.5 m exhibit stable performance (100% pass rate). Data indicate that longer FPC lengths result in longer average peak-reaching times and lower insulation pass rates.
Thus, increased length degrades insulation performance: accumulated parasitic capacitance along the length increases distributed capacitance, leading to uneven electric field distribution.
(2) Impact of Electromagnetic Shielding Film:
For lengths ≤1 m, the effect is negligible. At lengths ≥2 m, a significant impact occurs, prolonging peak time by 50–100% and reducing pass rate by ~5 percentage points.
When interfacial charge injection occurs, the conductive layer accumulates induced charge under high-voltage conditions, thereby concentrating the electric field at the edges.
This increases the field strength at the edges of the shielding film, as shown in Table 11.
| Length (m) | Without Shielding Film (Peak Time / s) | With Shielding Film (Peak Time / s) | Pass Rate Difference (%) |
|---|---|---|---|
| 0.5 | 0 | 0 | 0 |
| 1 | 1 | 4 | -3 |
| 2 | 4 | 13 | 0 |
| 3 | 6 | 20 | -5 |
| 3.39474 (Customer Size) | 7 | 16 | -5 |
| 4 | 8 | 26 | -10 |
Effect Verification
Using the optimal experimental conditions—line pitch 0.6 mm, cover film thickness ≤100 μm, and flexible board PI thickness 0.076 mm—the design incorporated an electromagnetic shielding film as required by the customer’s original specifications.
This film was fabricated from high-resistance shielding material with surface resistance >10⁶ Ω using a nano-carbon coating.
The ultra-long, thick copper FPC successfully achieved instantaneous peak insulation resistance values meeting customer requirements, as shown in Table 12.
No. | Design | Experiment (Group) | Standard Time | Average Time to Reach Peak (S) | Pass Rate / % |
|---|---|---|---|---|---|
| 1 | 1. Line spacing 0.6 mm ± 10%2. Cover film thickness 100 μm3. Flexible PCB PI thickness 0.076 mm4. High-resistance electromagnetic shielding film | 10 | 1–10 s | 0.5 (instant peak reached) | 100 |
| 2 | 1. Line spacing 0.6 mm ± 10%2. Cover film thickness 100 μm3. Flexible PCB PI thickness 0.076 mm4. High-resistance electromagnetic shielding film | 10 | 1–10 s | 0.8 (instant peak reached) | 100 |
| 3 | 1. Line spacing 0.6 mm ± 10%2. Cover film thickness 100 μm3. Flexible PCB PI thickness 0.076 mm4. High-resistance electromagnetic shielding film | 10 | 1–10 s | 1 (instant peak reached) | 100 |
| 4 | 1. Line spacing 0.6 mm ± 10%2. Cover film thickness 100 μm3. Flexible PCB PI thickness 0.076 mm4. High-resistance electromagnetic shielding film | 10 | 1–10 s | 1.4 (instant peak reached) | 100 |
| 5 | 1. Line spacing 0.6 mm ± 10%2. Cover film thickness 100 μm3. Flexible PCB PI thickness 0.076 mm4. High-resistance electromagnetic shielding film | 10 | 1–10 s | 1.2 (instant peak reached) | 100 |
| 6 | 1. Line spacing 0.6 mm ± 10%2. Cover film thickness 100 μm3. Flexible PCB PI thickness 0.076 mm4. High-resistance electromagnetic shielding film | 10 | 1–10 s | 2 (instant peak reached) | 100 |
Conclusions
Through systematic experiments and data analysis, this paper investigates the key factors influencing the insulation performance of ultra-long thick copper FPCs and their optimization strategies.
Based on factors such as line width/spacing, dielectric layer thickness, cover film thickness, FPC length, and electromagnetic shielding film, the mechanism of insulation performance was verified and analyzed.
This led to the derivation of an optimal design scheme to address quality issues where the insulation resistance of ultra-long, thick copper FPCs fails to reach peak values or cannot stably maintain them.
Experimental results indicate that insulation failures primarily stem from: – Micro-damage in dielectric layers caused by accumulated parasitic capacitance and mechanical stress concentration – Charge injection at interfaces and edge electric field distortion induced by charging/discharging effects and electric layers
Modifying dielectric materials, line width/spacing designs, and incorporating high-resistance shielding materials can effectively enhance the insulation reliability of long-length FPCs.
This research provides theoretical foundations and practical methods for optimizing insulation performance in high-power flexible electronic devices, holding significant implications for long-length FPC applications in new energy vehicles, aerospace, and other fields.