How to Achieve High Precision in Flexible Copper Clad Laminates Using Dual-Laser Etching?
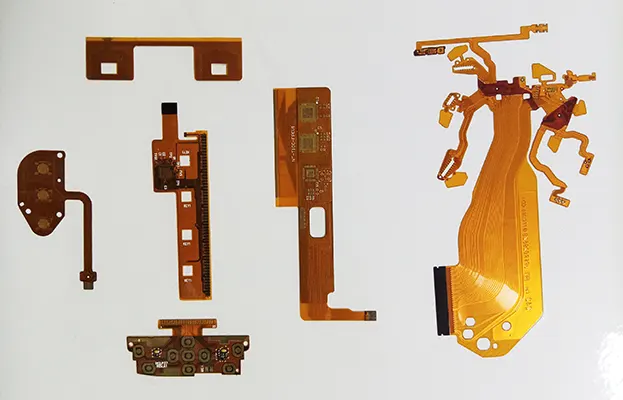
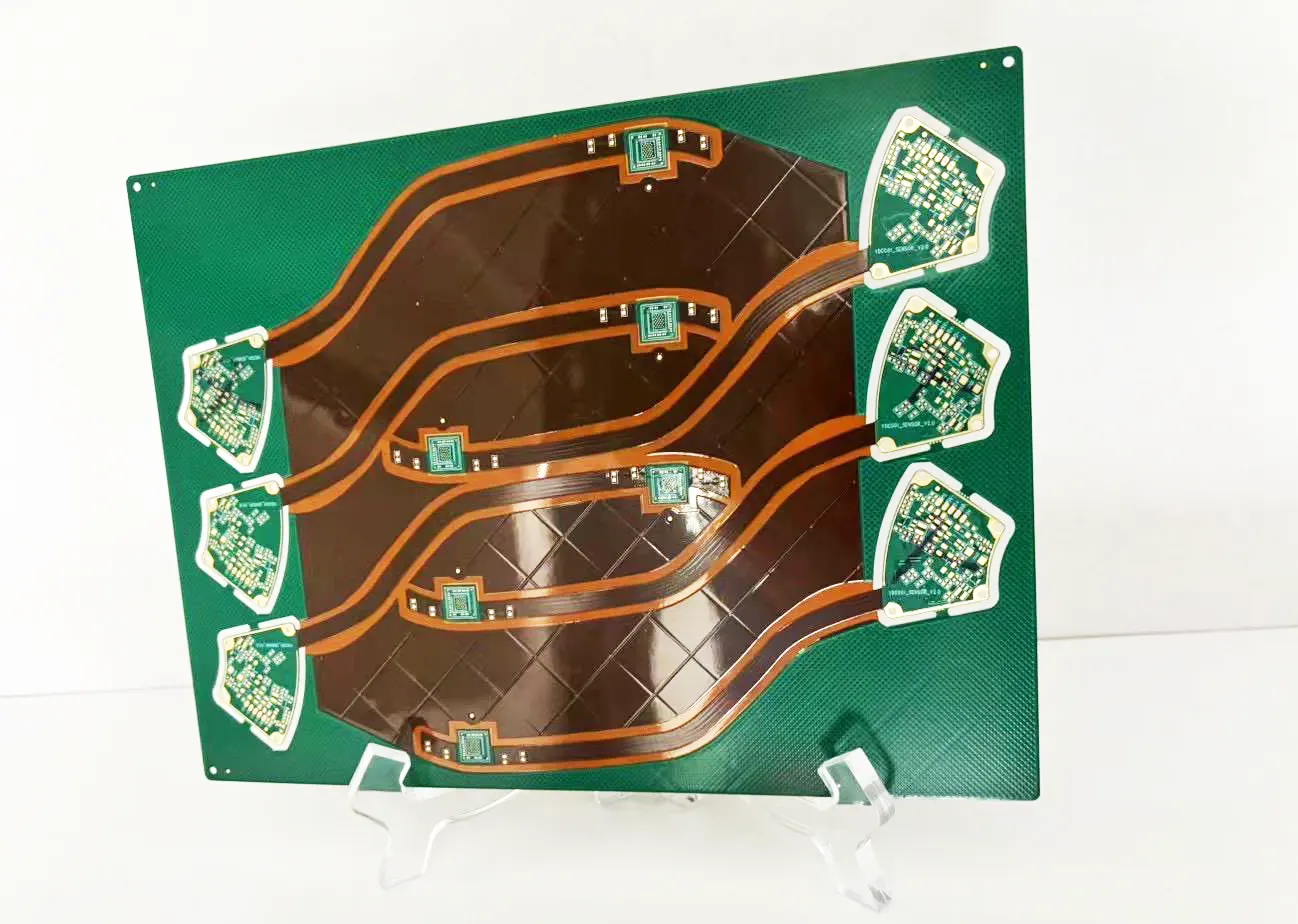
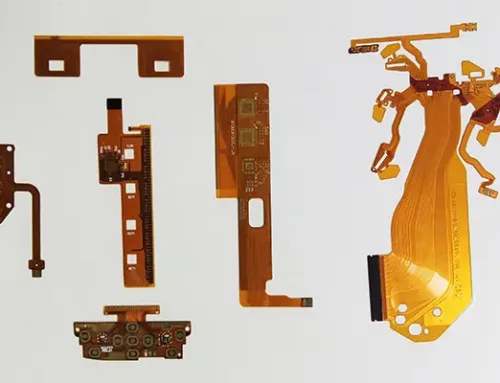
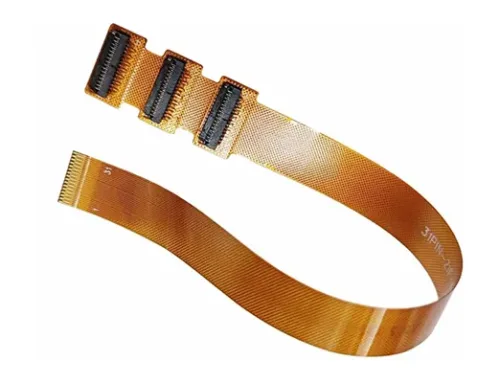
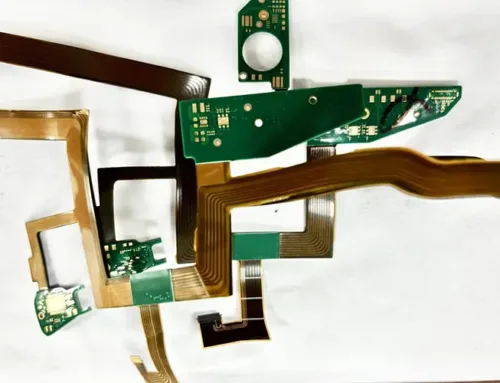
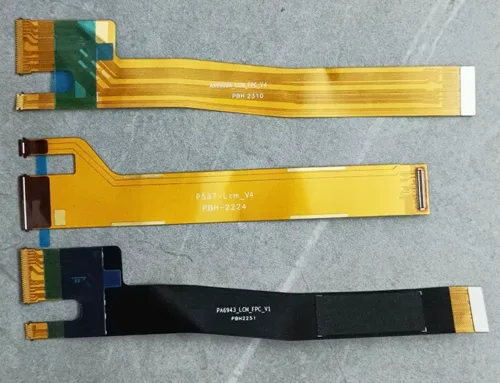
Flexible copper-clad laminate (FCCL), serving as the substrate material for flexible printed circuits (FPC), offers distinct advantages such as lightweight, flexibility, compact size, and excellent heat resistance.
Manufacturers widely adopt it in electronic products to achieve miniaturization and portability. This approach aligns with the development trends of high-precision electronics industries such as micro-robotics, new energy vehicles, 5G communication devices, and flexible displays.
However, traditional micro-hole processing methods—such as mechanical drilling, plasma hole formation, and electrochemical etching—have hindered the application and advancement of FPCs. These limitations stem from insufficient processing precision, low efficiency, high stress generation, and environmental pollution.
Advantages and Challenges of Laser Micro-Hole Processing
Laser micro-hole processing offers significant advantages, including universal applicability across materials, non-contact operation, high precision, low stress, and environmental friendliness. Consequently, it has seen widespread adoption in flexible circuit board manufacturing in recent years.
Current research efforts to enhance the precision and quality of micro-hole processing in flexible copper-clad laminates primarily focus on two approaches. One involves optimizing nanosecond laser processing parameters, while the other adopts ultrafast lasers, mainly femtosecond lasers.
Thermal effects, particularly excessive heat generation, inherently constrain the former approach and limit fundamental breakthroughs. The latter faces challenges such as high equipment costs and relatively low processing efficiency.
Concurrently, research on dual-laser combined etching and cleaning for FCCL remains scarce.
Dual-Laser Etching and Cleaning for FCCL
Therefore, this study employs a dual-laser system to perform first-order blind via processing on FCCL using a layered etching method:
First, a UV nanosecond laser performs windowing on the copper layer using a concentric circular scanning method;
Subsequently, operators use both UV nanosecond and UV picosecond lasers to etch the polymer layer via a helical scanning method, simultaneously cleaning the entire blind hole;
Finally, researchers comprehensively compared and analyzed nanosecond and picosecond laser processing based on experimental data and acquired images. They evaluated etching depth precision, hole bottom and surface roughness, and overall morphology.
This simultaneously validated the processing quality of this dual-laser (etching and cleaning) process, achieving high-precision, high-quality, and high-cleanliness blind hole processing for FCCL.
Laser-Material Interaction Mechanisms
The interaction mechanism between ultraviolet lasers and FCCL involves photothermal removal and photochemical stripping.
Specifically, photothermal mechanisms dominate during metal etching. Under intense laser irradiation, intense bremsstrahlung causes free electrons in the skin layer to absorb energy, inducing electron thermalization.
At this stage, electrons exhibit a Fermi-Dirac distribution, and they transfer the absorbed photon energy to the crystal lattice via electron-phonon coupling, allowing the lattice to establish thermal equilibrium in approximately 100 ps.
Stages of Photothermal Interaction
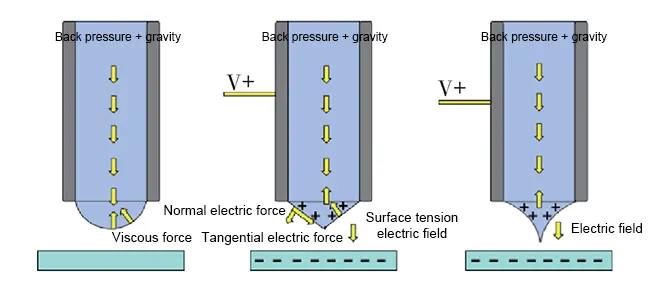
Additionally, the photothermal mechanism exhibits four distinct stages at different power densities, as illustrated in Figure 1:
- Figure 1(a) depicts heat absorption in the skin layer.
- Fig. 1(b) depicts material melting and crater formation (where thermal wave propagation exceeds vaporization rates, accompanied by rising gas pressure, driving material penetration deeper).
- Figure. 1(c) illustrates evaporation jet formation;
- Fig. 1(d) shows vaporization jet perforation.

Figure 1: Four Stages of Laser Material Interaction at Different Power Densities
The dominant stage varies with different laser power densities. For instance, at power densities of 10⁸–10¹⁰ W/cm², the vaporization jet dominates material removal, significantly reducing thermal effects.
Photochemical Effects on Polymers
When ultraviolet lasers interact with polymers, both photothermal and photochemical stripping mechanisms occur simultaneously.
The single-photon energy of the emitted laser is 3.47 eV, exceeding the bond energies of C–C and C–N bonds in polyimide under normal conditions (approximately 3.4 eV). This enables direct cleavage of these chemical bonds, achieving relatively cold processing.
Ultrafast Laser Processing for Enhanced Precision
Overall, operators should minimize or avoid thermal effects to enhance processing quality. This means achieving material removal via vaporization while operating near the material’s damage threshold.
Since the pulse width’s relationship with the material’s electron-phonon relaxation time determines whether thermal effects occur during processing, it is essential to control the laser-material interaction time to ≤ 10⁻¹² s (picosecond scale), ensuring termination before energy transfer occurs between lattice sites (phonon-phonon relaxation).
Ultrafast lasers simultaneously satisfy the above conditions, delivering pulses with extremely high peak power at picosecond pulse widths that instantly reach the material’s damage threshold.
Furthermore, the pulse width of ultrafast lasers is shorter than the characteristic time of most physicochemical processes. At the same frequency, they offer a higher duty cycle, enabling longer cooling times that further suppress thermal effects.
Under these conditions, non-thermal processes dominate, significantly enhancing processing precision and quality.
Experimental Design
This experiment utilized double-sided FCCL with a thickness of 49 μm as the test specimen, comprising:
- copper foil (Cu) with a thickness of 12 μm (primarily serving a conductive function);
- polyimide (PI) with a thickness of 25 μm (providing structural support);
- and first-order blind holes with a diameter of 120 μm and a depth of 37 μm processed in this study.
Table 1 lists the laser processing equipment parameters.

Table 1: Laser processing experimental equipment parameters
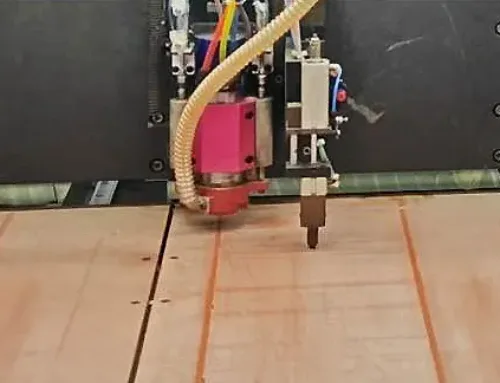
Researchers used LEXT OLS500 3D laser confocal microscopes for observation and acquired confocal images with a 1405 nm laser diode and a high-sensitivity photomultiplier tube, achieving a lateral resolution of 0.12 μm. Figure 2 shows the experimental scheme.

Figure 2: Experimental Setup
Laser Processing Methodology
In the first stage, operators used an ultraviolet nanosecond laser with a concentric circle scanning method. By adjusting the laser parameters, they etched a 120 μm diameter, 12 μm thick window onto the copper-clad laminate, completely removing the copper foil and exposing the polymer layer.
The second stage employed both nanosecond and picosecond lasers for polymer layer etching and cleaning, respectively. Researchers applied a spiral scanning method, treating laser power, frequency, scan count, and scan speed as the four factors, and conducted an orthogonal experimental design with four levels for each factor.
Parameter Optimization and Validation
Researchers used etching depth and surface roughness data to identify the influence weights and best levels for each factor, selected the optimal parameter combination through a comprehensive balancing method, and carried out validation and comparative experiments with this set.
Figure 3(c) illustrates the spiral scanning etching and cleaning process for the copper-clad laminate, with an inter-path spacing of 30 μm.

Figure 3 Schematic Diagram of FCCL First Order Blind Via Processing
To achieve thorough cleaning of surface overlayers, operators set the spiral top radius to 80 μm—extending 20 μm outward from the blind hole radius—thereby forming an annular cleaning zone around the micro-holes.
During the experiments, researchers used a metallurgical microscope and a laser confocal microscope for real-time rapid scanning and image acquisition of the blind holes. At the same time, they measured etching depth as well as surface and bottom roughness.
To more accurately reflect processing quality and error issues, each parameter set underwent 100 repeated trials, with surface roughness (rather than line roughness) serving as the evaluation criterion.
Analysis of Experimental Results
Analysis of Nanosecond Laser Window-Opening Test Results
Figure 4 presents laser windowing processing images. Figure 4(a) and (b) show observations under conditions of power P = 6 W, frequency f = 100 kHz, scanning speed v = 550 mm/s, and scanning count n = 2, captured using a metallurgical microscope and a laser confocal microscope, respectively.

Fig 4: Cross-section of laser-etched copper layer
A window with a diameter D = 122.24 μm and a deviation value of 2.24 μm was obtained. The etching depth was approximately 14.28 μm, with minimal over-etching of the polymer layer, achieving complete removal of the copper layer.
As shown in Fig. 4(b), distinct spatter deposits and spurs were observed at the edges of the micro-holes, with a measured surface roughness of 2.13 μm.
Analysis of Orthogonal Test Results
◊ Analysis of Nanosecond Laser Orthogonal Test Results
Continuing etching after windowing, preliminary ranges for processing parameters in nanosecond laser etching of polymer layers were determined based on extensive experimental data.
An orthogonal test was designed with four factors—laser power (A), repetition rate (B), scan count (C), and scan speed (D)—each at four levels. Table 2 presents the factor level table.

Tab 2 Factor level table
An L16(44) orthogonal experiment was designed based on the factors and levels in Table 2. Table 3 presents the orthogonal experimental design and results.
Table 3 indicates that different combinations of processing parameters yield varying blind hole depths and roughness values. When analyzing data to identify the optimal processing combination, the weight assigned to processing depth in the evaluation criteria is greater than that assigned to roughness.

Tab 3 Orthogonal experimental factor design and results
» Range Analysis of Orthogonal Test Data
Table 4 presents the range analysis results of the orthogonal test data. The k value represents the mean etching depth and roughness corresponding to a given factor at different levels.
For etching depth, achieving the target depth takes priority. Within each factor, the closer the k value is to 37.00 μm, the more likely that level represents the optimal parameter for that factor under the etching depth criterion.
For example, in Table 4, under the etching depth factor, k2 is closer to 37.00 μm than k3 in the scan count levels. However, since the k2 level fails to meet the required etching depth, the k3 level should be selected as the optimal parameter for this factor.
Regarding roughness, a smaller k value under a given factor indicates that the corresponding level represents the optimal parameter for that factor in terms of roughness.
The Range (R value) represents the range of k values for a given factor, reflecting the influence of each factor on the test results (R value is proportional to correlation).
Table 4 indicates that the influence weights of factors on etching depth are A > C > B > D, with average power having the most significant impact.

Table 4 Range analysis
» Parameter Optimization and Comprehensive Balancing
Comparing the k values of each factor allows selecting the combination A2B2C3D2. The magnitude of influence on roughness is A > B > C > D, with average power having the most significant impact. Following the principle of selecting the smallest k value, one can choose the combination A2B4C2D3.
The comprehensive balancing method is applied to optimize the two selected parameter combinations:
1) Power. The optimal level factor for the first parameter in both sets is A2, thus selecting A2.
2) Repetition frequency. The optimal frequency levels in the two sets are B2 and B4. While B2 achieves complete polymer layer removal, it causes over-etching and yields the highest roughness. B4 produces the lowest roughness but suffers from insufficient etching depth. Therefore, B3 is selected.
Similarly, the study determines the optimized parameters for processing cycles and speed. Thus, the optimal parameter combination for the nanosecond laser in this process is A2B3C3D2, corresponding to: power P = 3.5 W, repetition frequency f = 100 kHz, processing cycles n = 3, and scanning speed V = 800 mm/s.
◊ Analysis of Picosecond Laser Orthogonal Test Results
A picosecond laser simultaneously etched the PI layer and cleaned blind vias, following evaluation metrics and principles consistent with Section 4.2.1.
Each of the four processing factors received four levels, the team designed orthogonal experiments, and analyzed the data using the online statistical software SPSSAU. Table 5 presents the factor level table.

Table 5 Factor level table
Based on Table 5, an L16(4⁴) orthogonal experiment was designed for each factor and level. Table 6 presents the orthogonal experiment design and results.
Table 6 shows that etching depths fluctuated between 34.35 and 38.24 μm across different parameter combinations, with both incomplete etching and over-etching phenomena observed.

Tab 6 Orthogonal experimental factor design and results
The bottom surface roughness fluctuates between 0.23 and 0.75 μm, showing minimal overall variation. This indicates negligible or absent thermal effects during picosecond laser processing.
Table 7 indicates that for etching depth, the influence weights of each factor are A > B > C > D, with output power having the greatest impact.

Table 7 Range analysis
Based on the optimal levels of each factor, the parameter combination A3B1C4D1 is selected. Similarly, for surface roughness, the influence weights of factors are A > D > C > B. Based on the optimal levels, the selected parameter combination is A4B2C2D1.
After comprehensive balancing, the selected parameter combination is A3B1C4D1, corresponding to power P = 5 W, repetition rate f = 80 kHz, processing cycles n = 7, and scanning speed V = 800 mm/s.
Experimental Validation and Comparative Analysis
Based on the optimal parameter combinations selected for both nanosecond and picosecond lasers, copper-clad laminates were etched.
Table 8 shows that under optimized parameters, both lasers achieved significantly improved processing accuracy and quality. The picosecond laser demonstrated superior etch depth, hole bottom roughness, and surface roughness compared to the nanosecond laser.

Table 8 Optimization process etching results
◊ Hole Bottom Morphology
Bottom surface under nanosecond laser:
Figure 5(a) shows a darker bottom brightness with scattered black spots (unremoved polymer melt and copper-carbon mixture);
Figure 5(c) shows pronounced undulating patterns at the bottom. Compared with the picosecond laser, the longer exposure time of the nanosecond laser allows residual heat to diffuse into the surrounding area through thermal effects.
This diffusion increases undulations in the etched grooves and ultimately results in higher roughness and damage to the copper layer.
Picosecond laser-treated hole bottom:
Figure 5(b) exhibits high brightness (reflected light from the copper layer, indicative of cleanliness) and excellent uniformity, with virtually no dark spots or obstructions;
Figures 5(c), 6(b), and 6(d) demonstrate exceptionally high bottom flatness and cleanliness, with negligible protrusion. This achieves complete removal of polymers and residues while preserving the integrity of the substrate morphology.
◊ Surface Cleaning Zone:
As shown in Figure 5(a), a distinct annular cleaning zone exists at the microhole edges. Under nanosecond laser irradiation, both the cleaning range and etching scratches are larger than those under picosecond laser irradiation. Although the deposits are cleaned, damage is inflicted on the copper layer.
As shown in the blind hole surfaces of Fig. 5(b) and Fig. 6(a), the picosecond laser exhibits no significant ablation phenomena.
Surface spatter is effectively removed, and the etching marks are shallow, effectively preserving the morphology of the copper layer.
After laser cleaning, the surface roughness decreased from 2.13 μm to 0.25 μm, achieving significant improvement.

Figure 5 Observation of Blind Holes After Laser Etching and Cleaning
Sidewalls: Figures 6(b) and (d) display cross-sectional views of the blind hole. The images reveal excellent sidewall uniformity with no overhanging material, no significant resin shrinkage, and no serrated etching scratches.

Figure 6 Schematic of picosecond laser etching and cleaning of blind holes under optimized parameters
Conclusion
This study employed dual lasers for first-order blind hole etching and cleaning of copper-clad laminates. Comprehensive comparison of processing results yields the following conclusions:
1) Orthogonal experimental design optimized the process. Through range analysis combined with the comprehensive balance method, we obtained optimal parameter combinations, significantly enhancing experimental efficiency, processing effectiveness, and accuracy.
2) Under optimized parameter processing, the process etched and cleaned the FCCL, producing high-quality blind holes with a diameter of 122.24 μm, a depth of 37.02 μm, a bottom surface roughness of 0.16 μm, and a surface roughness of 0.25 μm.
Comparative analysis indicates that picosecond lasers demonstrate superior performance across all processing metrics.
3) Laser cleaning of blind holes significantly streamlined the processing workflow and comprehensively enhanced hole cleanliness. Surface cleaning not only removed deposits (reducing surface roughness from 2.13 μm to 0.25 μm) but also minimized damage to copper foil, maximally preserving the copper layer’s integrity.
This research holds significant reference and guiding value for improving blind via processing precision and quality, particularly in addressing the widespread issue of residual material clogging in laser micro-hole processing that prevents circuit conductivity, as well as for developing related equipment.