AI-Driven Optimization of Flexible Circuit Board Production Processes

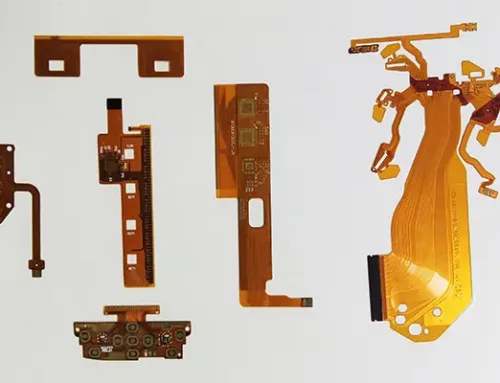
With the trend toward thinner and lighter electronic products, flexible circuit boards have gained widespread adoption in smart terminals, wearable devices, and medical equipment due to their bendable nature and high space utilization.
Flexible circuit board manufacturing faces challenges such as controlling material deformation, having narrow process windows, and significant environmental interference, making traditional fixed-parameter control methods inadequate for meeting high-precision production demands.
Intelligent control technology employs a perception-decision-execution closed-loop system to achieve adaptive parameter adjustment. Research focuses on developing smart control systems and exploring the mapping relationship between parameters and performance to enhance production quality and efficiency.
Analysis of Flexible Circuit Board Manufacturing Challenges
Flexible circuit boards, with their lightweight, bendable, and three-dimensional spatial layout advantages, have become indispensable components in modern electronic devices.
During production, flexible circuit boards encounter numerous manufacturing challenges.
For instance:
- Substrates with high thermal expansion coefficients are prone to warping and deformation under high-temperature conditions;
- Increasing circuit miniaturization demands micron-level alignment precision, which traditional mechanical positioning methods struggle to achieve.
- Narrow exposure parameter windows make imaging quality susceptible to fluctuations in environmental humidity;
- Cumulative interlayer alignment errors significantly impact yield rates, resulting in generally low production rates for multilayer boards.
Process Optimization Methods Based on Intelligent Control
Intelligent Control System Architecture Design
The intelligent control system architecture incorporates a multi-level closed-loop control structure and real-time process parameter monitoring mechanisms.
The multi-level structure comprises a basic control layer (utilizing fuzzy proportional-integral-derivative control algorithms), a process parameter coordination layer (employing model predictive control), and a product quality optimization layer (utilizing deep reinforcement learning).
It employs bottom-up information flow and top-down control flow to form a hierarchical collaborative system.
Real-time process parameter monitoring relies on a high-precision sensor network integrating temperature monitoring (thermocouple arrays), pressure monitoring (piezoresistive thin-film sensors), and time monitoring (optical sensors).
Coupled with data preprocessing modules and anomaly detection algorithms, data is transmitted via 5G industrial gateways to ensure precise control decisions.
Multi-Sensor Data Acquisition and Fusion Technology
The multi-sensor data acquisition system comprises a temperature sensing network, a pressure monitoring array, a positional accuracy tracking system, and an environmental parameter monitoring module.
As shown in Table 1, the temperature sensing network employs a hybrid deployment strategy that combines PT100 platinum resistance thermometers and Type K thermocouples, achieving a measurement accuracy of ±0.1°C.

Table 1 Types and performance parameters of multiple sensors
The pressure monitoring array integrates 64 piezoresistive sensing units with spatial resolution reaching 0.5 mm.
The positional accuracy tracking system combines visual recognition and laser interferometry to achieve positioning precision exceeding one micrometer.
Environmental parameter monitoring covers critical indicators, including humidity, particulate matter mass concentration, and electrostatic field strength.
Data fusion employs a hierarchical strategy. The lower layer employs Kalman filtering for data smoothing and noise reduction. The middle layer applies D-S evidence theory to resolve conflicts between heterogeneous data.
The upper layer utilizes deep learning for feature extraction and state estimation, ultimately constructing a unified process state representation model that provides a reliable data foundation for intelligent control.
Adaptive Optimization Algorithm for Process Parameters
Parameter Optimization Method Based on Deep Reinforcement Learning
The deep reinforcement learning parameter optimization method models the flexible circuit board production process optimization problem as a Markov decision process.
The state space encompasses process parameters and product quality indicators, while the magnitude and direction of parameter adjustments define the action space.
The reward function comprehensively considers product quality, production efficiency, and energy consumption. The algorithm adopts a Deep Q-Network architecture, incorporating dual networks and a priority experience replay mechanism to enhance learning efficiency and stability.
The core of DQN achieves parameter optimization through the Q-value update formula:
![]()
Where:
- Q(st, at) denotes the expected cumulative reward from action at taken in state st at time step t;
- Est+1 represents the anticipated reward of the next state at time step t+1;
- rt is the immediate reward obtained at time step t, reflecting the impact of current parameter adjustments on product quality;
- γ is the discount factor, set to 0.95 to balance short-term and long-term optimization objectives;
- maxQ(st+1, at+1) represents the maximum Q-value achievable by selecting the optimal action at+1 in the next state s(t+1) that may be reached at time step t+1.
Determination of Process Windows Under Multi-Objective Constraints
The determination of process windows under multi-objective constraints employs an improved Non-dominated Sorting Genetic Algorithm (NSGA), with product quality, production efficiency, and resource consumption serving as optimization objectives.
This algorithm constructs a three-dimensional parameter space (temperature, pressure, and time) and establishes a mapping model between parameters and objective functions using Gaussian process regression.
Its enhancements include several key improvements. First, an adaptive crossover operator is introduced to dynamically adjust crossover probabilities based on population diversity. Second, a reference-point selection strategy is designed to ensure a more uniform distribution of the Pareto front. Finally, a local search mechanism is integrated to accelerate convergence.
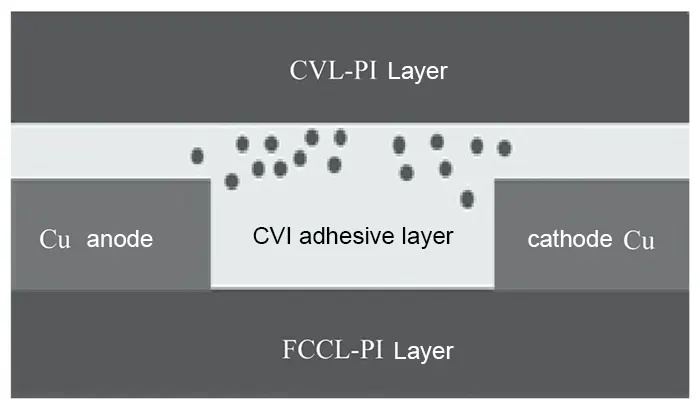
Figure 1 illustrates the pressure variation curve of the pressure-time co-optimization control model, highlighting differences between traditional and intelligent optimization control. This model divides the pressing process into three stages:
During the material softening phase, pressure gradually increases to the process requirement value. In the hot pressing forming phase, constant pressure is maintained to ensure sufficient material flow and interlayer bonding.
During the cooling and curing phase, pressure is gradually released to prevent excessive internal stress in the material.
Verification through comparative experiments demonstrates significant process improvements achieved by the intelligent control system:
Post-optimization, pressure stability improved to within ±2%, pressure distribution uniformity reached 92.8%, and time control accuracy increased to within ±0.5 seconds. After 100 generations of algorithm iteration, an optimal process parameter window was obtained.
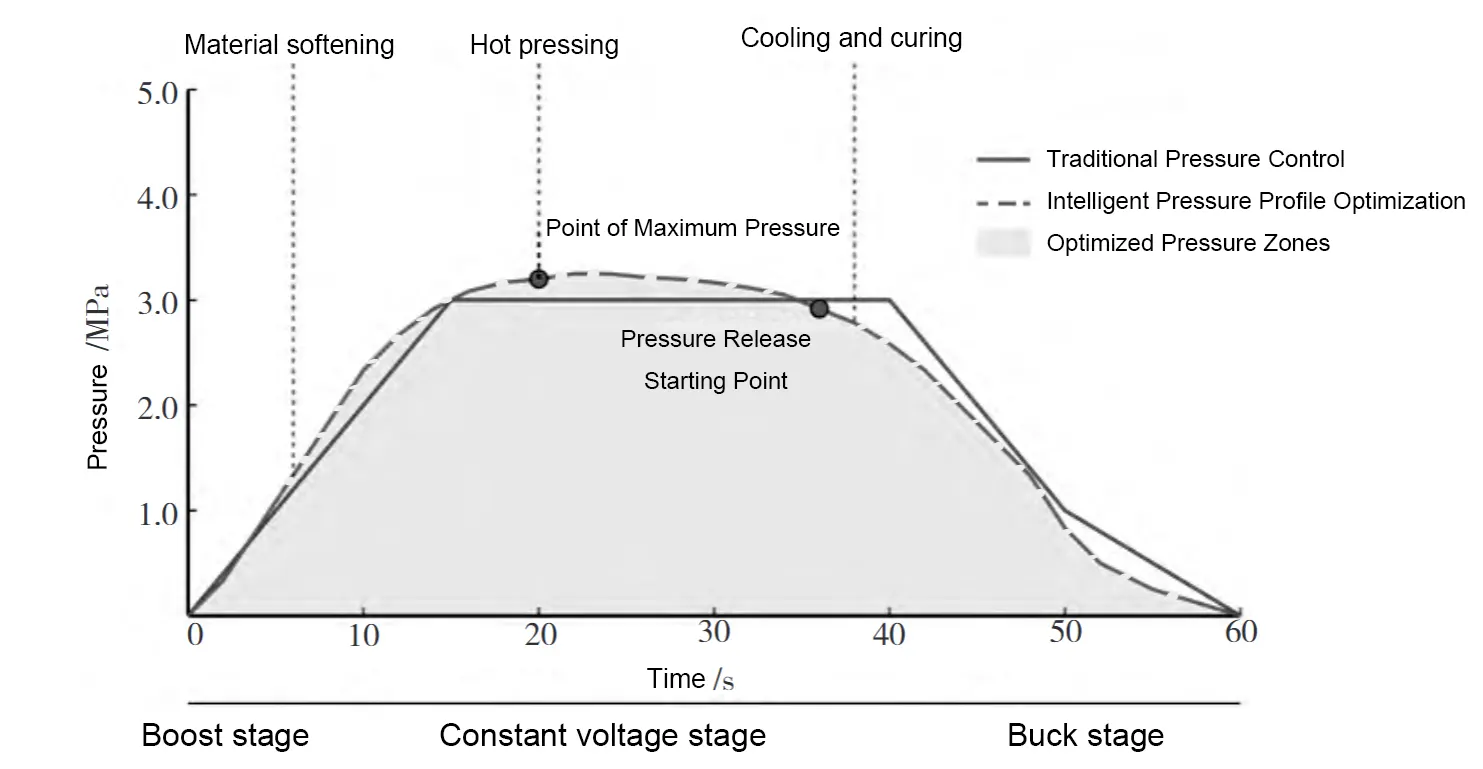
Figure 1 Pressure-time co-optimization control model
Verification of Intelligent Control Process Optimization Effects
Experimental Design for Key Process Parameter Optimization
An orthogonal experimental design method was employed to validate the effectiveness of the intelligent control system’s optimization in producing flexible circuit boards.
The researchers selected an L16 (4×5) orthogonal array and conducted 16 experiments. These experiments analyzed five key factors—temperature, pressure, time, rate, and environmental humidity—each set at four levels.
To evaluate intelligent control performance, the experiments were divided into two groups. One group used traditional fixed-parameter control, while the other adopted intelligent adaptive control.
As shown in Table 2, the temperature factor ranged from 165 to 180°C, while pressure varied between 3.0 and 3.6 MPa.
This configuration comprehensively covered the feasible range of process parameters. Sample preparation strictly adhered to the IPC-6013D standard, with each set of process parameters tested five times to eliminate random errors.
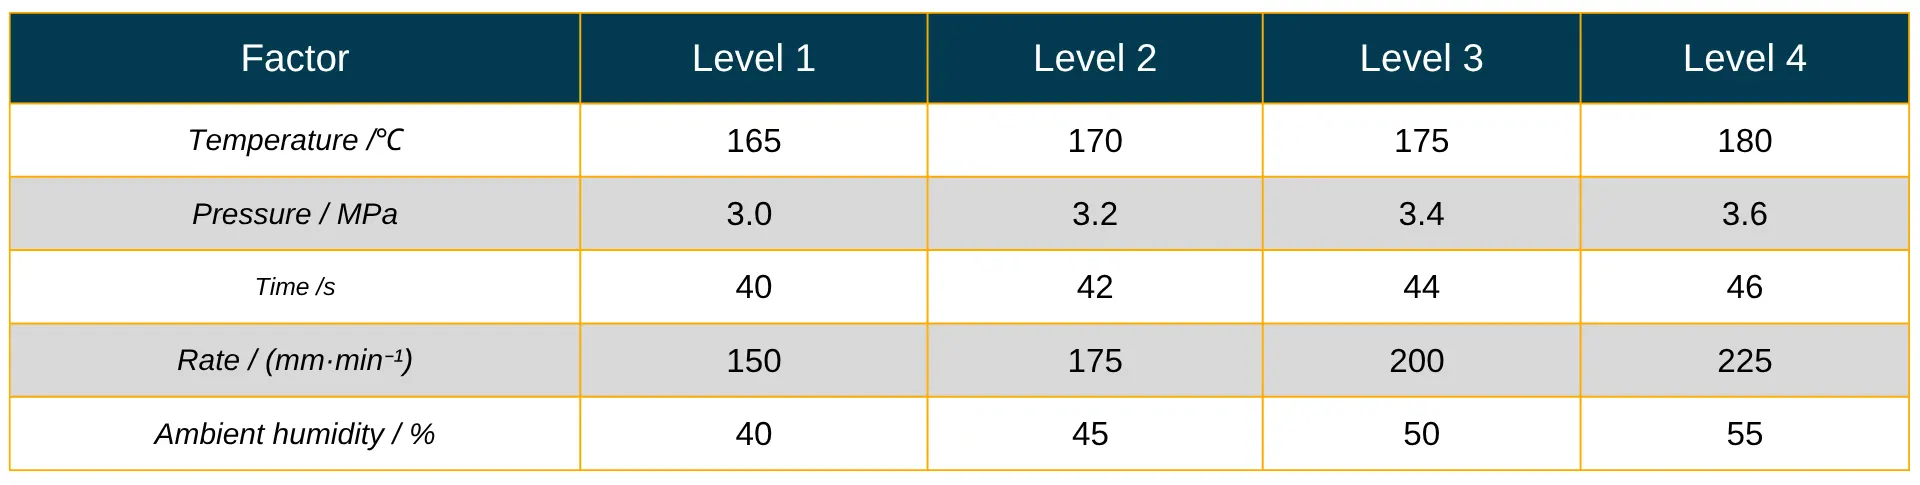
Table 2 Level settings for process parameter factors
Comparison of Process Stability Before and After Optimization
Process stability comparison utilized the process capability index and standard deviation as core evaluation metrics. Statistical analysis of 30 consecutive days of production data quantified the enhancement achieved by the intelligent control system.
Under traditional control, significant parameter fluctuations occurred: temperature variation reached ±2.8°C, pressure variation exceeded 8%, and time deviation was approximately 4.5%.
The intelligent temperature control system employs a fuzzy adaptive proportional-integral-derivative (PID) control algorithm combined with a feedforward compensation strategy.
After implementation, the team controlled temperature fluctuations within ±0.5°C, achieving 96.7% temperature field uniformity. By using a coupled model, they synergistically optimized pressure and time parameters, which are defined by the following formula:
![]()
Where:
- P(t) denotes pressure at time t;
- Pmax represents the maximum process pressure.
- α is the pressure ramp rate control coefficient, determining pressure rise speed;
- t is the current time.
- β is the pressure maintenance coefficient, influencing stability during the constant-pressure phase.
- γ is the pressure release coefficient, controlling the rate and curve profile during the pressure reduction phase;
- tmax is the total pressurization time.
Following optimization, pressure stability improved to ±2%, indicating more stable process control. At the same time, pressure distribution uniformity reached 92.8%, ensuring more consistent load transfer. In addition, interlayer bonding strength increased by 18.7%, which significantly enhanced material rheology and the curing reaction process.
Evaluation of Product Quality and Production Efficiency Enhancement
After implementing the intelligent control system on the flexible circuit board production line for six months, the team conducted a comprehensive assessment of product quality and production efficiency.
Regarding quality, the first-pass yield rate increased from 81.3% to 96.8%, defect density decreased by 75.4%, and the reliability test pass rate improved by 22.6%.
Microstructural analysis revealed a 1.2% improvement in conductor line cross-sectional profile consistency. In addition, it showed a 28.3% increase in interlayer alignment accuracy. Furthermore, a 24.7% enhancement in dielectric layer thickness uniformity was observed.
In terms of production efficiency, output per unit increased by 19.3%, while energy utilization efficiency rose by 15.3%; consequently, overall equipment effectiveness (OEE) climbed from 67.5% to 86.2%.
Conclusion
Using intelligent control, researchers have made significant achievements in optimizing the production process of flexible printed circuits.
Moreover, the intelligent control system enables real-time monitoring. At the same time, it allows precise regulation of key production parameters. As a result, it effectively addresses issues such as large temperature fluctuations, unstable pressure control, and insufficient exposure accuracy.
First, the established mapping model links process parameters to product performance. As a result, it reveals the influence mechanisms of each parameter on product quality. Consequently, this provides a solid theoretical foundation for parameter optimization.